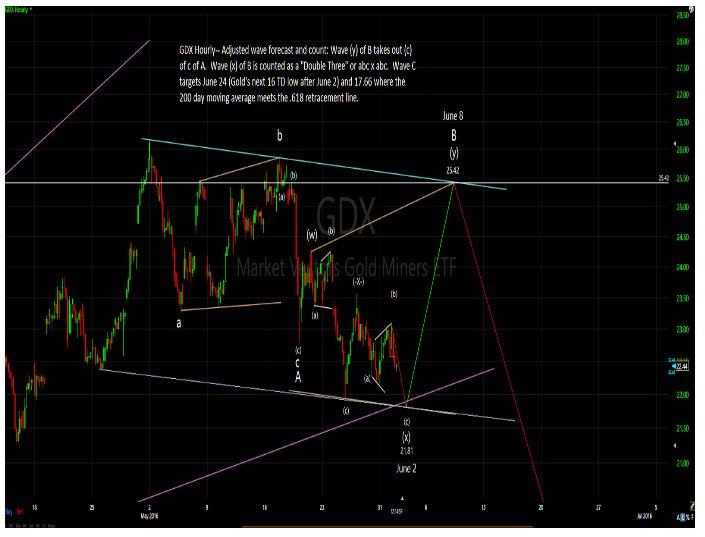
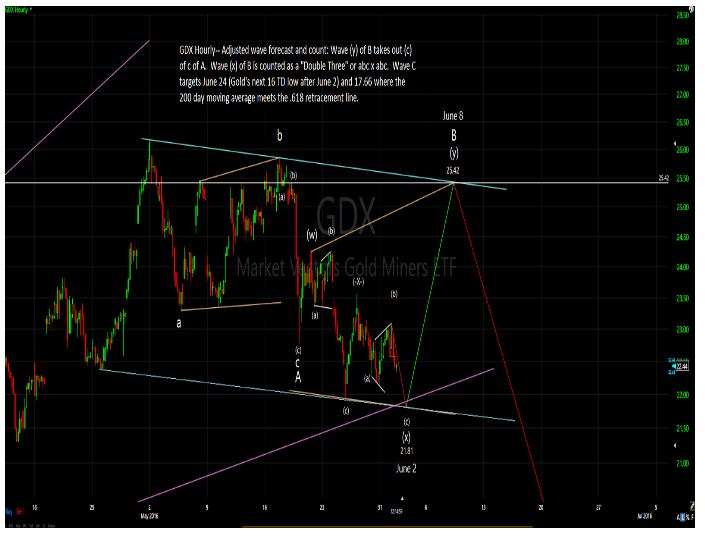
GDX and gold look to make their low around June 24, not June 17th as I had reported earlier. The cycles are following gold’s and not GDX’s cycle. June 2nd is a cycle change point (either a low or high) and happens to be the 16 TD low for gold.
The chart below shows GDX’s wave count ending an (x) of B wave on June 2 near 21.81 and rallying to 25.42 by June 8th to finish (y) of B. The terminus of Wave C should occur on June 24 near 17.66 for GDX.
IF GDX, gold and the stock market follow last year’s 9-month pattern (running 10 months) the stock market may not see its next important low until Monday, July 25, somewhat similar to the August 24, 2015 crash.


Leave A Comment