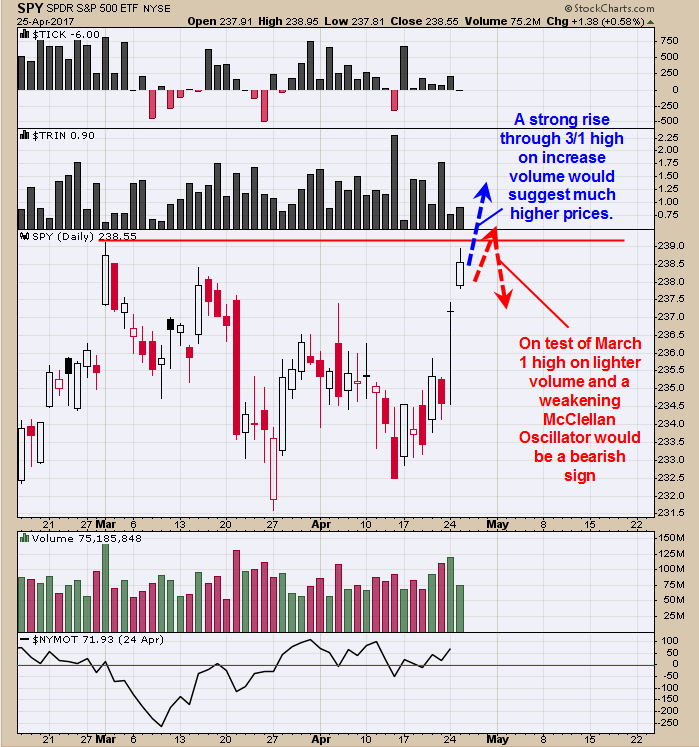
How the March 1 high is tested will tell a lot about the strength of the market. A strong rise through the March 1 high would be a longer term bullish sign. A test of the March 1 high on lighter volume with the McClellan Oscillator weakening would put the uptrend in question. Either way, market should at least test the March 1 high and we will see what develops there. Long SPX on 4/24/17 at 2374.15.

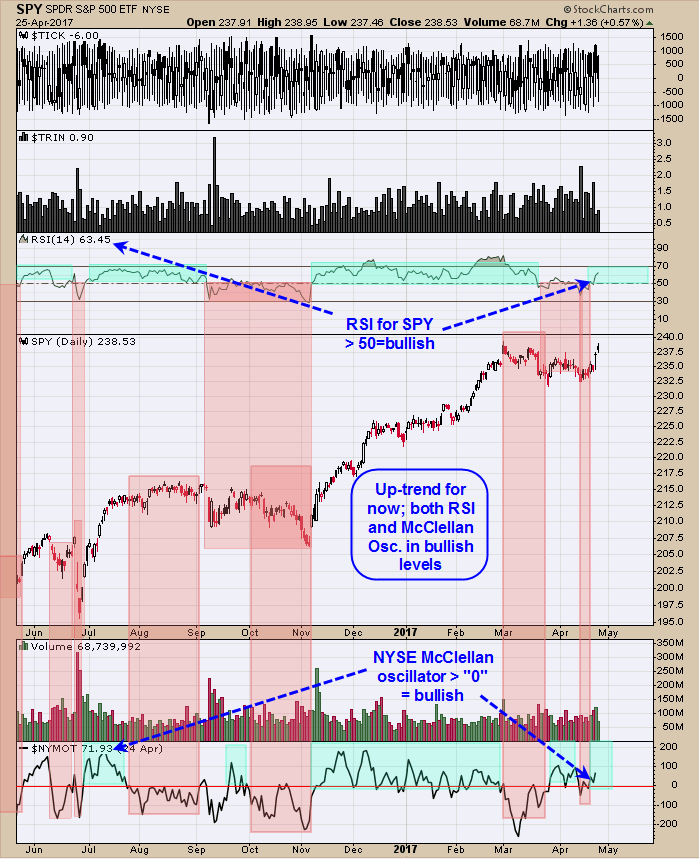
We define an uptrend is in progress when the RSI for SPY is > 50 and McClellan Oscillator > “0”. Today the RSI for the SPY closed at 63.45 and the McClellan Oscillator closed today at 106.18 up from yesterday close of 71.93. Its also a short term bullish sign when the McClellan Oscillator makes higher highs showing strength is present. March first high comes in at 239.28 on the SPY and could provide resistance. However, as long as the RSI stays above 50 and the McClellan Oscillator stays above “0”, the uptrend is intact. To help bolster the longer term, a McClellan Oscillator above +270 range would help as that would show strong liquidity.

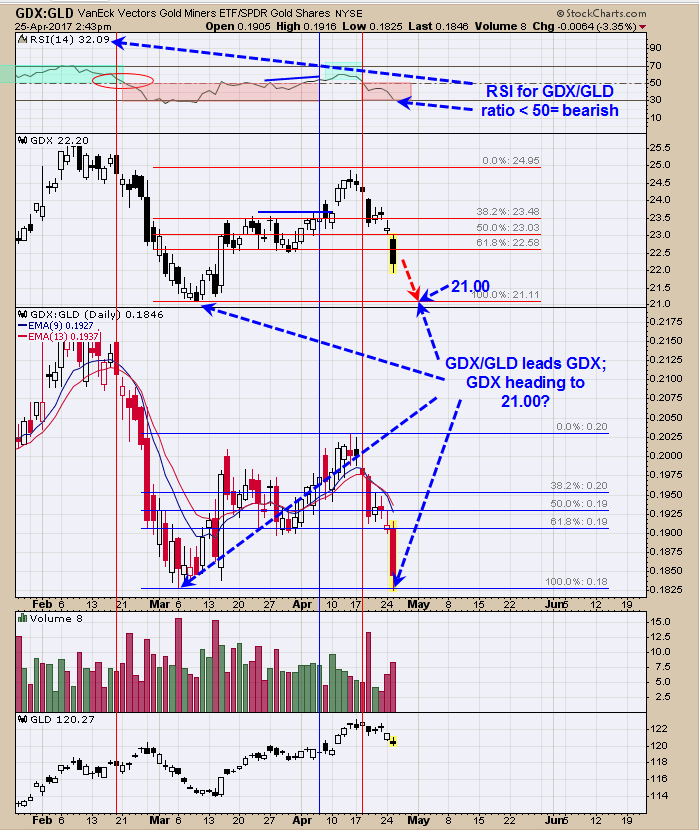
GDX/GLD ratio leads the way for GDX. The GDX/GLD ratio has dropped to its early March low, suggesting GDX is heading to its early March low near 21.00. It’s too soon to say that will be the final low, will have to wait and see what happens at the 21.00 level if or when GDX get there. The RSI for the GDX/GLD ratio (top window)fell below 50 on April 18 and remains below 50, suggesting the GDX/GLD ratio is still in a downtrend. If GDX/GLD ratio is in a down trend, than GDX also should be weak as GDX/GLD ratio leads the way for GDX. For the next low in GDX, the GDX/GLD ratio should show signs of a bullish divergence where GDX is weaker than GDX/GLD ratio. Another clue a GDX bottom is nearing is for GLD weaker than GDX. For now a possible target for GDX is the early March low near 21.00. For now we will be patience and wait for the next bullish setup.


Leave A Comment