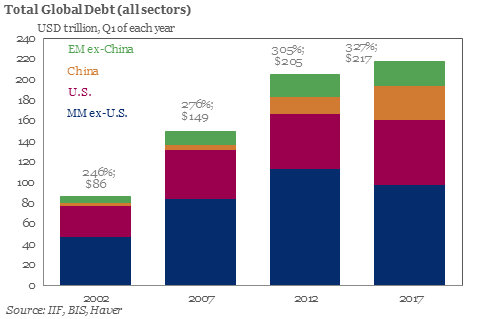
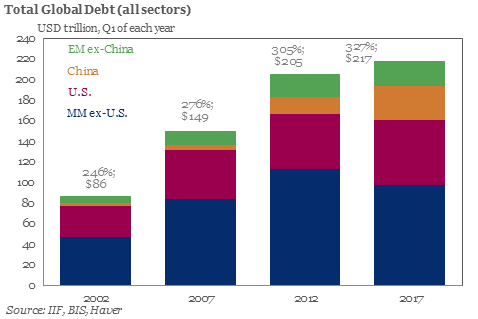
Last June we reported that according to the Institute of International Finance – perhaps best known for its periodic and concerning reports summarizing global leverage statistics – as of the end of 2016, in a period of so-called “coordinated growth”, global debt hit a new all time high of $217 trillion, over 327% of global GDP, and up $50 trillion over the past decade.

Six months later, on January 4, 2018, the IIF released another global debt analysis, which disclosed that global debt rose to a record $233 trillion at the end of Q3 of 2017 between $63Tn in government, $58Tn in financial, $68TN in non-financial and $44Tn in household sectors, a total increase of $16 trillion increase in just 9 months.
Now, according to its latest quarterly update, the IIF has calculated that global debt rose another $4 trillion in the past quarter, to a record $237 trillion in the fourth quarter of 2017, and more than $70 trillion higher from a decade earlier, and up roughly $20 trillion in 2017 alone.

The IIF report, which also sources data from the IMF and BIS, found that the share of global debt remains well above 300% of global GDP, with mature market, i.e., DM, debt/GDP now at 382%. The silver lining: that number was slightly below recent levels, as increasing GDP growth in DMs helped reduce the debt-to-GDP ratio. However, this was more than offset by a surge in debt in emerging markets, where total debt/GDP is now well above 200%.
The good news, if only temporarily, is that on a consolidated basis, global debt/GDP fell for the fifth consecutive quarter as global growth accelerated: the ratio is now around 317.8%, or 4% points below the all time high hit in Q43 2016. To be sure, even a modest slowdown in GDP growth, let alone a contraction, will promptly send the ratio surging to new all time highs.
So what was the culprit for this unprecedented debt surge? Central banks of course.


Leave A Comment