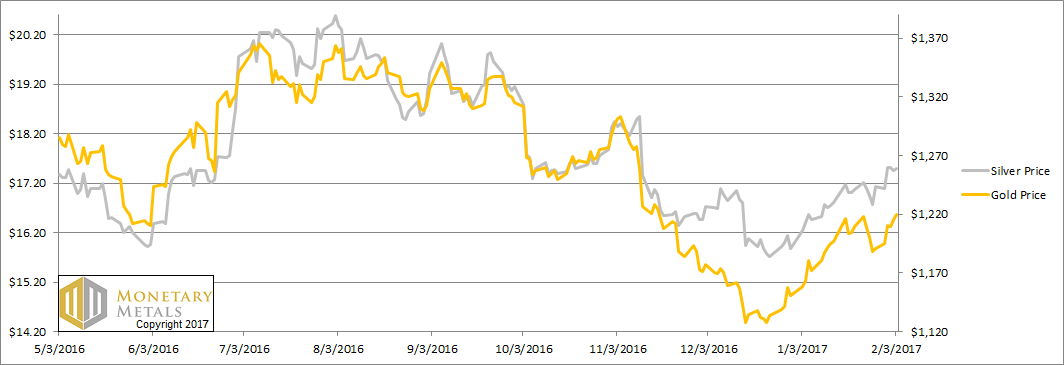
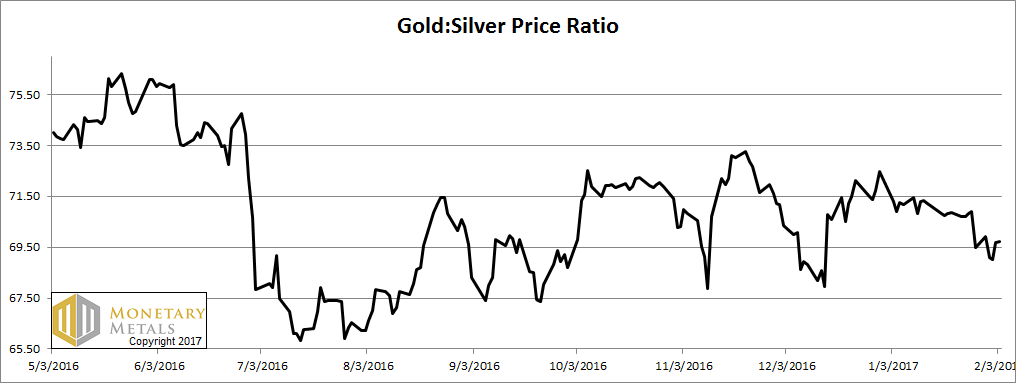
This week, the prices of precious metals went up, with the gold price rising every day and the silver price stalling out after rising 42 cents on Tuesday. The gold-silver ratio went up a bit this week, an unusual occurrence when the prices are rising. Everyone knows that the price of silver is supposed to outperform—the way Pavlov’s Dogs know that food comes after the bell. Speculators usually make it so.
This will be a brief report this week, as we are busy working on something new and big.
Below, we will show the only true picture of the gold and silver supply and demand fundamentals. But first, the price and ratio charts.
The Prices of Gold and Silver

Next, this is a graph of the gold price measured in silver, otherwise known as the gold to silver ratio. It rose slightly this week.
The Ratio of the Gold Price to the Silver Price

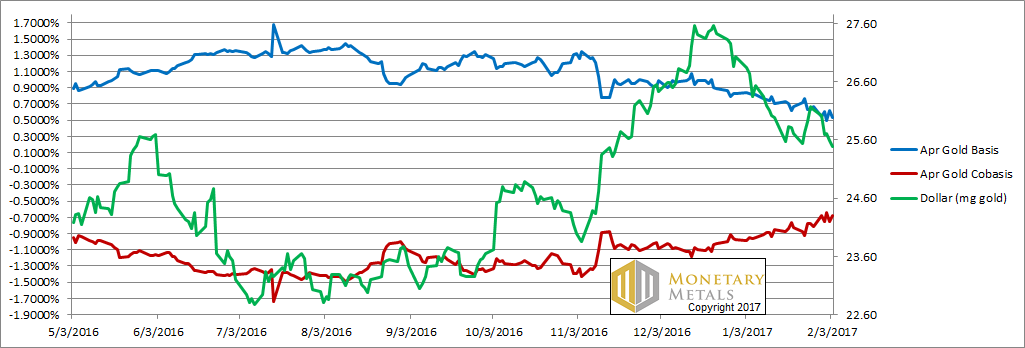
For each metal, we will look at a graph of the basis and cobasis overlaid with the price of the dollar in terms of the respective metal. It will make it easier to provide brief commentary. The dollar will be represented in green, the basis in blue and cobasis in red.
Here is the gold graph.
The Gold Basis and Cobasis and the Dollar Price

Do we have rising price of gold, up $25 (i.e. falling dollar, from 26mg to 25.5mg gold)? Yes. Do we have rising scarcity of gold (i.e. the cobasis, our measure of scarcity)? Why yes, we do.
This resumes the pattern that began the last week of December. The price of gold made a low of $1,127 (i.e. the dollar made a high of 27.6mg). Since then, the price of gold has been rising (i.e. the dollar has been falling) while the scarcity of gold has been rising.
Not a lot. Not Defcon 5, gold is going to spike to $10,000 (i.e. the dollar is going to crash to 3mg gold). Not a big obvious crisis-looking sort of move. Just a gradual move from -100bps to -68bps. What makes it significant is that it occurred with rising price. Gold is becoming scarcer as its price rises.


Leave A Comment