Gold is at a pivotal point. Prices dropped $200 since April’s botched breakout attempt. We have a failed cycle and prices collapsed below support at $1200. The moving averages are down and trending lower. The charts – well, are frankly bearish. Gold needs to mount a miraculous turnaround to revive the bullish potential.
Factors Supporting A Miraculous Reversal
The stage is set, and it looks like gold formed a bottom (possibly major) at $1,167. The price action over the next 4-8 weeks will confirm. The critical level to overcome is $1310. Above that and a breakout above $1370 becomes expected. However, a sustained decline below the $1124 support zone would harden the bearish evidence.
US DOLLAR WEEKLY
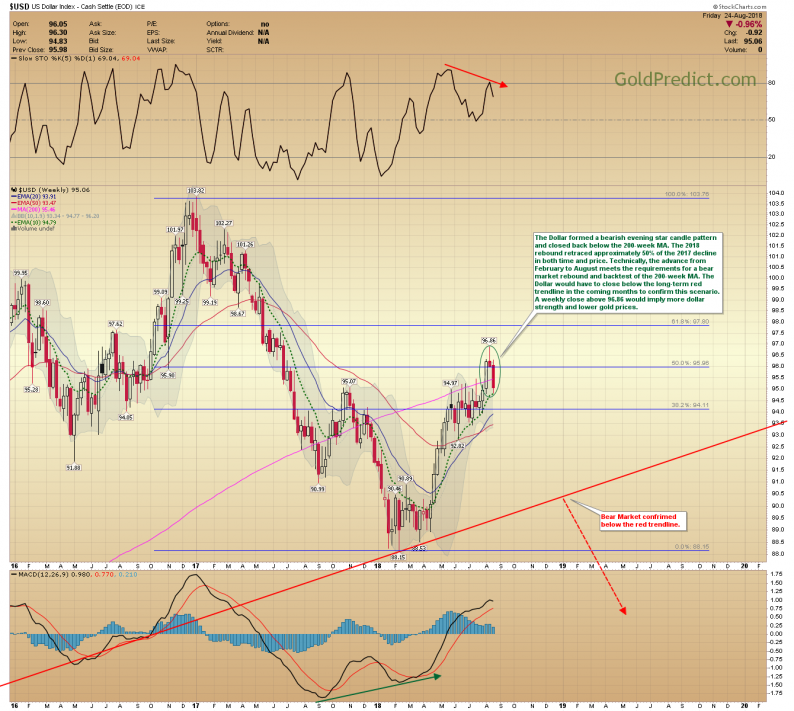
The Dollar formed a bearish evening star candle pattern and closed back below the 200-week MA. The 2018 rebound retraced approximately 50% of the 2017 decline in both time and price. Technically, the advance from February to August meets the requirements for a bear market rebound and backtest of the 200-week MA. The Dollar would have to close below the long-term red trendline in the coming months to confirm this scenario. A weekly close above 96.86 would imply more dollar strength and lower gold prices.

US DOLLAR DAILY
The dollar is 50 days into a cycle that usually averages 54-60 trading days between lows. Prices should drop a bit further and bottom within the next 1-2 weeks. From there, I think prices will rally for 2-3 weeks, top (maybe near the September rate hike) and then decline into November.


Leave A Comment