Gold and Silver have held up well during the recent selloff in equities. From December 28 through Wednesday the broad NYSE lost 10.4% while the S&P 500 lost 9.6%. Precious Metals gained strength during that period. Gold advanced 3.0% while Silver gained 1.7%. Gold relative to the NYSE broke its downtrend and touched an 11-month high. Gold relative to global equities (excluding the US market) reached a 2-year high. Precious metals have clearly benefited from the equity selloff but therefore figure to lose strength as the equity market begins a relief rally.
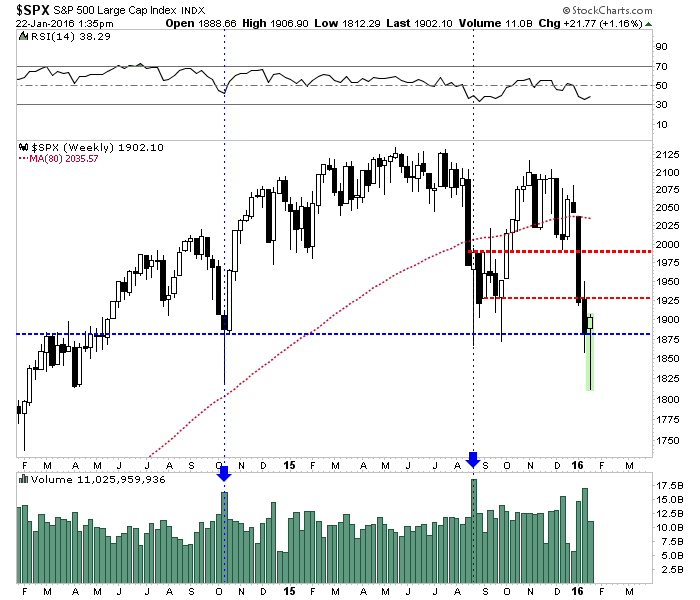
Equities have become very oversold and are forming a bullish reversal. The weekly candle chart of the S&P 500 is shown below. The market is forming a bullish hammer (reversal candle) right at important support. The week is not over but we expect volume to be sizeable. The last two hammers on big volume came at the October 2014 and August 2014 lows. The market became extremely oversold this week as only 15% of stocks within the NYSE were trading above their 200-day moving average. That is the lowest figure in more than four years. Furthermore, various sentiment indicators are showing extreme pessimism. The AAII survey for example is showing the lowest amount of bulls since 1987.

S&P 500 Weekly Chart
The S&P 500 could rally as high as 1990 where there is major resistance. Wednesday’s low should hold for at least a few months.
The recent poor performance of the gold miners is another signal that the metals (Gold and Silver) are at risk of making lower lows. During the aforementioned period when the metals were positive the miners (GDX and GDXJ) lost 9.6% and 12.0%. That relative and nominal weakness is a strong signal that the recent strength in the metals is unlikely to last.
GDX and GDXJ are charted below. The miners are recovering in part due to the recovery in the stock market. They are also retesting Tuesday’s breakdown to new lows. The rally has been weak as there is strong resistance overhead in the form of recent support ($18 for GDXJ and $13 for GDX) and the 50-day moving averages.


Leave A Comment