Gold closed above $1,300 per ounce for the first time in 5 years as the U.S. dollar saw it’s worst decline over the past 14 years. Despite a strong start in 2017, XAUUSD spent most of the year in a sideways range around $1250 area before the final bounce came by year end to allow the precious metal to close for +13% in gains.
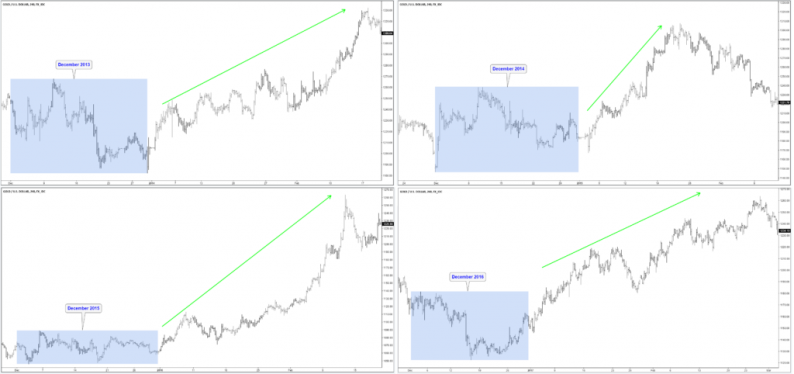
During the past 4 years, Gold has been repeating the same pattern over and over again, bottoming around December then rallying during the first quarter of the new year.
GOLD Previous December Lows

In 2017, Gold peaked in September at $1357 before starting a 3 months decline to correct the rally from December 2016. I reached the 50% – 61.8 Fibonacci retracement area ( $1251 – $1226 ) where buyers where waiting to start a new cycle higher again in December. Up from there, XAUUSD rallied strongly breaking above $1300 to end the correction.
GOLD Daily Chart 2017

The move in metals led by Gold helped The Dow Jones Commodity Index to continue it’s bullish uptrend since 2016 low showing higher highs then higher lows and making a new high above September peak which opens a another bullish extension for the index supporting the rest of commodities to remain strong during 2018.
DJCI Daily Chart

Recap
Gold is looking for a strong rally during 2018 and breaking above September 2017 peak is the key level for the precious metal to target $1450 area. The move will be supported by the rest of commodities as DJCI has a bullish sequence to the upside following the same path.


Leave A Comment