Gold price edged higher as the US Dollar declined, increasing the appeal of anti-fiat assets epitomized by the yellow metal, after the Senate’s tax cut proposal underwhelmed. Lawmakers must now try to reconcile this offering with the one emerging from the House of Representatives last week. This hints at seesaw volatility ahead as Fed rate hike bets oscillate with incoming headlines from Washington DC.
Crude oil price struggled to find lasting direction absent directly pertinent news-flow. Baker Hughes rig count data as well as ICE and CFTC speculative positioning statistics are due ahead, but these rarely generate a significant response. That may anchor the WTI benchmark to sentiment trends. S&P 500 futures are accelerating lower ahead of the opening bell on Wall Street, hinting this might translate into weakness.
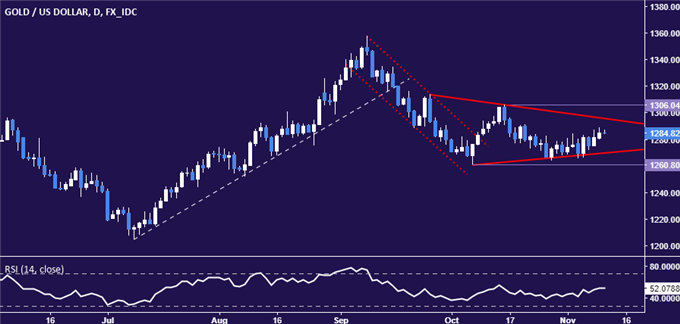
GOLD TECHNICAL ANALYSIS – Gold prices are carving out a Triangle pattern, a setup typically indicative of trend continuation. This carries bearish implications in this case, although confirmation of the setup remains absent without a clear break below the pattern’s lower bound (now at 1270.14). That would open the door for a test of the October 6 low at 1260.80. Alternatively, a push above Triangle resistance at 1295.80 initially exposes the October 16 high at 1306.04.

Chart created using TradingView
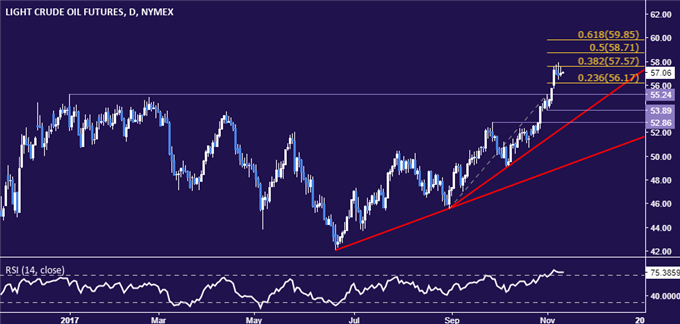
CRUDE OIL TECHNICAL ANALYSIS – Crude oil prices remain stuck below resistance at 57.57, the 38.2% Fibonacci expansion. A daily close above that targets the 50% level at 58.71. Alternatively, a reversal back below the 23.6% Fib at 56.17 exposes resistance-turned-support at 55.24, the January 3 high.

Chart created using TradingView


Leave A Comment