‘It was the young year’s landmark week, the Dollar’s knees going weak:
Gold’s Key Pop:
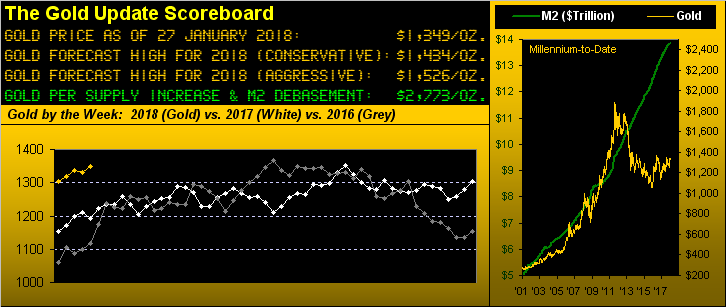
Last year’s high of 1362? Gone, price trading up to 1365 in the 06:00 GMT hour on Thursday. For the run toward our “conservative” forecast high in 2018 of 1434, getting past last year’s peak is a first milestone, the next one obviously being Base Camp 1377. Once thought to be the saving grace following Gold’s fallout from its All-Time High of 1923 (06 September 2011), 1377 has since morphed into the thorn in Gold’s side — or perhaps better stated — into its head. So much so that 1377 has been in the title of two prior Gold Updates and went on to become our correctly forecast high for 2016, (revised upon price clearing the 1280 level that year). Now having settled yesterday (Friday) at 1349 — and the “expected weekly trading range” presently at 28 points — Gold can stand on the 1377 threshold in a mere week’s time. Should we there arrive, does 1377 then become the point of no downside return?
We’ve been around enough decades to identify a stock market “blow-off” when we see one. And yesterday’s finale to the week sure looked like one. The S&P 500 — already beyond “overbought” by so many measures that they all ought be discarded as useless into the dust bin — on Friday traded 149% of its “expected daily trading range”, going essentially straight up post-lunch. Our take remains that the tax cut’s benefit to corporate bottom lines was priced into the market when the S&P went up by better than 100 points in mere days during afterglow of the stateside election back in November 2016, the Index then reaching 2200. Today it is nearly 2900. Our “live” price/earnings ratio for what has now slipped to become the “S&P 422” (’twas the “S&P 424”) — by benevolently excluding those constituents earning less than $1/share — is now up to the wild-ass level of 39.2x. Seriously? Q1 earnings will tell the tale when they start flowing in right around Tax Day (15 April).


Leave A Comment