Although it didn’t appear to be a breakdown, silver just closed the day (and week) at a new yearly low. Remember the day when silver moved briefly below $14? Ultimately, silver futures closed at $14.15 on that day, and they just closed at $14.14 on Friday. So little, yet so much. Breakdown confirmed by weekly closes is something very significant and yet, it’s not the most important thing that we will comment on in today’s analysis. The key details will come from the gold market. Let’s move right to it (charts courtesy of http://stockcharts.com).

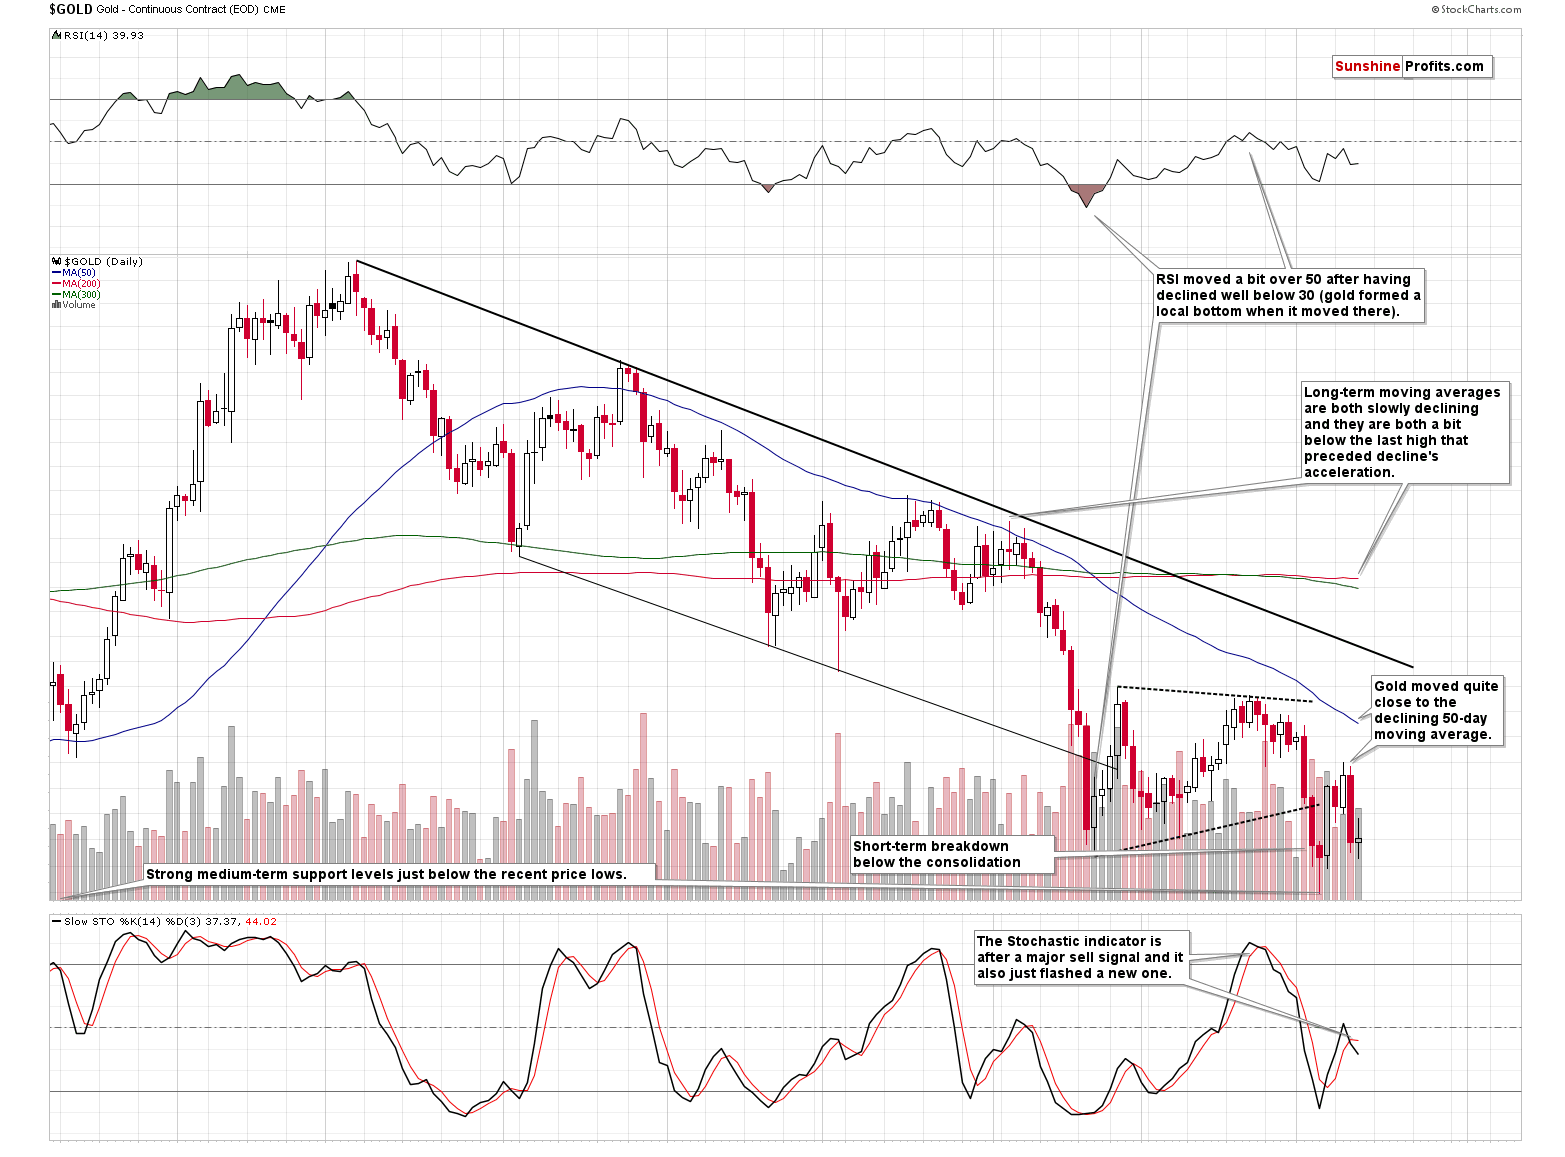
Gold moved back and forth lately as it’s been consolidating after the recent sharp decline that took gold to the medium-term support levels (even a bit below some of them) and the declining thin black support line (based on the previous lows).
The yellow metal moved close to its 50-day moving average (staying below it) and it’s still far from the declining black resistance line, which suggests that the trend remains down and that everything that we saw recently is just a pause within a bigger decline.
The RSI indicator was very oversold on a short-term basis during the recent volatile bottoming pattern, but it recovered since that time, and it recently even moved above 50, thus indicating that the situation is far from being very oversold on a short-term basis.
The Stochastic indicator already confirmed that the major short-term top is already in and we just saw another move lower in it, after it moved above the middle of its trading range.
Moreover, gold already broke below the consolidation pattern marked with dashed lines and even though it moved very briefly back into the pattern, it closed the last two sessions visibly below it.
Some will say that what we’re seeing is just a prolonged bottoming pattern and what we have now is the first post-bottom pause. But we disagree. Based on multiple other factors, including severe underperformance of gold stocks, the gold price projection remains strongly bearish. The yellow metal appears ready to decline once again.


Leave A Comment