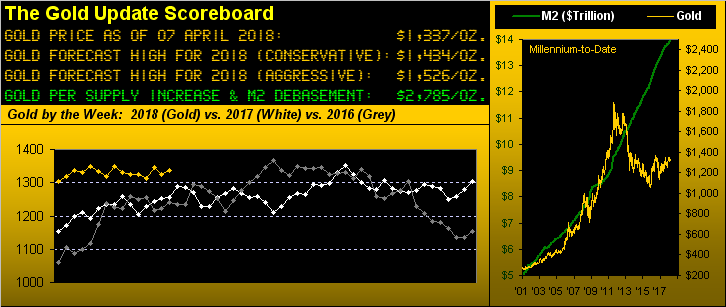
Four fast figures facts:
What’s it all mean?
The once Great American Savings Account on occasion reminds us it is not always that which it seems: the S&P rightly “corrected” by better than 50% in the years 2000-2002 and again in 2007-2009. Now it is anew losing its shine, although perhaps by not as much this time; we’ll again review at the -25% line (S&P 2154). Meanwhile Gold, the over-arching savings account for all time, quietly sits with a nod and a wink to Silver for it to lead out on the next precious metals climb.
But does Gold climb from here, or is the end of this weekly parabolic Long trend near? For our doting dot counters out there, the present ascent of blue dots numbers 13 weeks: that’s but half the longest Long run millennium-to-date of 26 weeks (June-December in 2005), which itself is one of five mutually-exclusive parabolic Long runs of 20 or more weeks since 2001. To be sure, as we turn to Gold’s weekly bars, the tight range year-to-date stands stark: quite zany it is given all the other markets’ disruptions over this plight and that. But we’ll take the graphic’s rising dashed trendline versus being stuck within the purple bounds of The Box (1280-1240) every time; (and, per a valued reader’s recommendation, we’ve added to the stats the Gold/Silver ratio when +80x):


Leave A Comment