In recent days Gold has been more oversold than the gold stocks. Entering this week, the gold stocks were fresh off a major technical breakdown. An upside or downside break can lead to a market stretching beyond what typically qualifies as overbought or oversold. After Monday’s selloff, the gold stocks are hitting oversold levels but have more to go before reaching true oversold extremes.
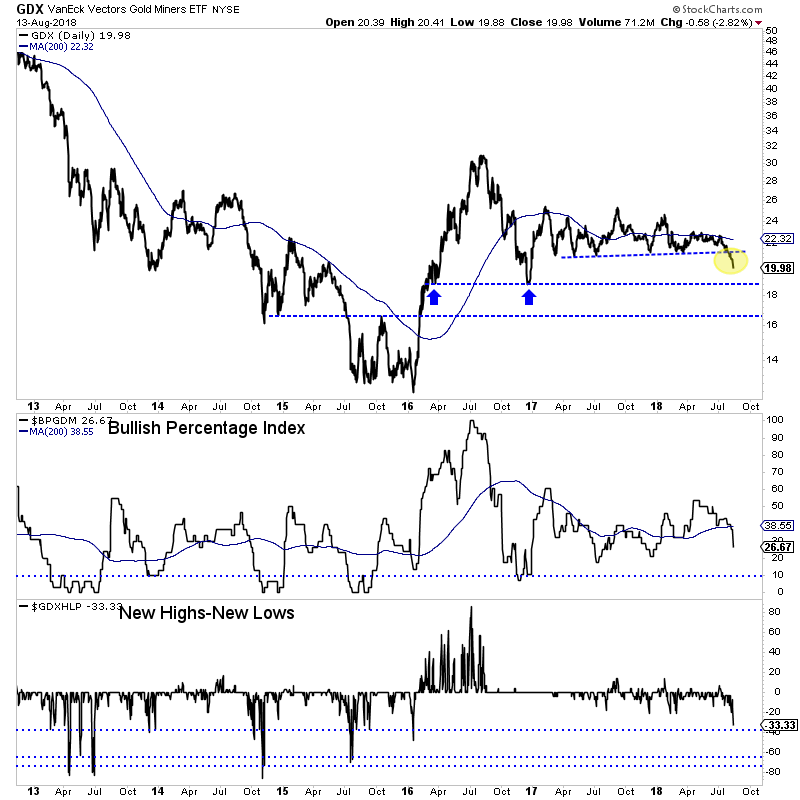
Below we plot GDX along with the bullish percentage index (BPI), a breadth indicator, and new highs less new lows expressed as a percentage. The BPI declined to 26.7%. That remains well above its major lows of the past five years. New highs less new lows hit -33% Monday. That is close to an oversold extreme, which we would consider anything surpassing -40%.

GDX closed just a hair under $20.00 and does not have strong support until the December 2016 lows in the high $18s.
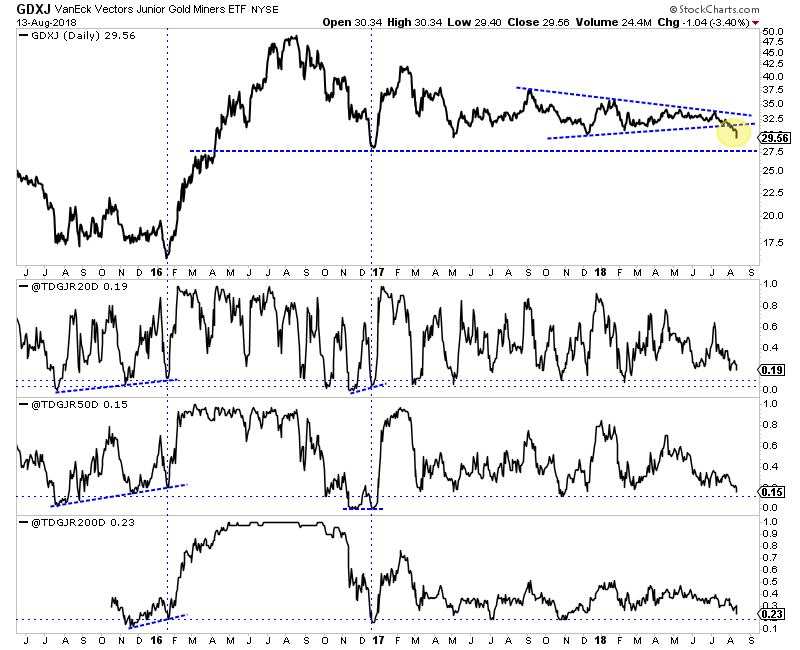
Next we plot GDXJ along with some custom breadth indicators. Those indicators show the percentage of stocks within a 55-stock basket that closed above their 20-day, 50-day and 200-day moving averages. While these figures tumbled on Monday, they have yet to hit extremes. For example, 19% of the basket closed above its 20-dma. Most lows occur below 10%. The other two are closing in on oversold extremes but are not quite there yet.

GDXJ closed Monday at a new 52-week low and a new 18-month low. It would need to fall another 6% to test strong support around its December 2016 low.
Monday’s decline in the gold stocks has moved the sector into oversold territory. Another day or two of a similar decline would likely put the various breadth indicators into extremely oversold territory. Within the context of a significant technical breakdown and a primary downtrend, one should wait for oversold extremes before turning bullish or covering shorts. We informed subscribers Sunday that we will take profits on our large short positions as GDX and GDXJ approach their December 2016 lows.


Leave A Comment