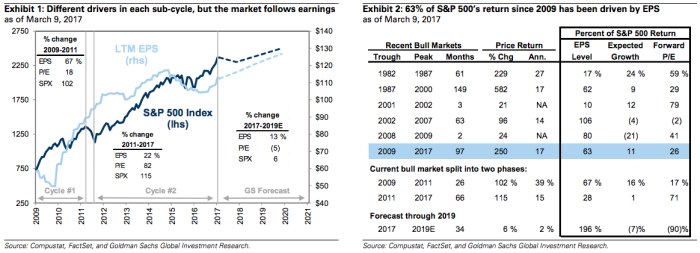
Anyone remember the chart in the right pane below?

(Goldman)
You’ll note there’s something particularly unnerving (well, if you’re long it’s unnerving, if you’re on the sidelines it’s pretty funny) there. Specifically, note the part of the table that says “current bull market split between two phases.” See where Goldman breaks down the percent of the index return by contributor during the second phase (2011-2017)? Yeah, so that “71%” part means that three quarters of the index’s return since the 2011 debt ceiling lows is attributable to you (or someone) paying more for every dollar of earnings. Here’s what Goldman said last month:
But the current bull market is really a tale of two sub-cycles (Exhibit 1). During the first phase (March 2009 to April 2011), the market rallied on the back of a rebound in earnings from the depths of the Global Financial Crisis. Higher profits accounted for 66% of the index’s 102% gain while P/E multiple expansion explained just 17% of the rally (faster expected EPS growth contributed the remainder; see Exhibit 2).
Since the market low of 1099 in 2011, the S&P 500 has climbed by 115%. This second phase of the bull market has lasted more than five years and has been driven mostly by an increase in valuation rather than the level of profits. The adjusted P/E multiple climbed to 18x from 10x, explaining 71% of the rise in the index. Higher earnings accounted for just 28% of the rise.
Now I don’t want to get too far into the earnings growth outlook here, but suffice to say that between policy implementation delays in Washington and the following chart which shows you how this usually turns out, I’m not entirely sure that betting on an earnings growth renaissance is a particularly safe bet:

(Goldman)
So by extension (and yes, this is a gross oversimplification), the fate of the rally is probably going to be left to multiple expansion which again, has been the case for going on six years now.


Leave A Comment