The sell-off in credit over the past week has led many investors to ask what it means for equities. Credit spread widening usually has negative implications for equity but as Goldman notes, it is critical to estimate the degree to which the equity market has already priced the weakness to determine the potential risks to equity going forward. Interestingly, Goldman finds the weakness in high yield credit was foreshadowed by weakness in the equities of high yield companies (like for like), but the weakness in Investment Grade credit spreads relative to their corresponding equities represents a new divergence suggesting meaningful downside for S&P 500 investors.
HY credit weakness has caught up with HY equity weakness
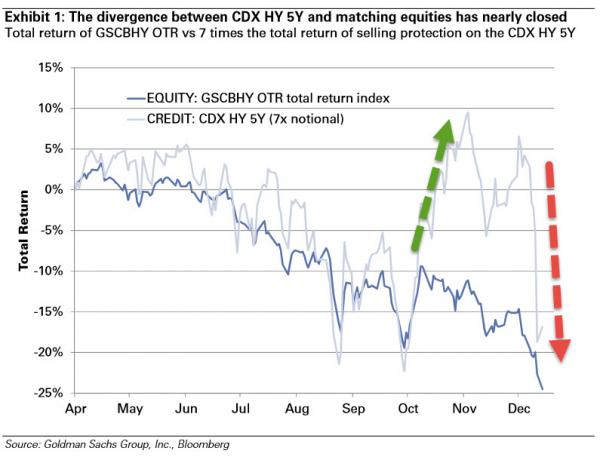
Goldman’s analysis shows that the weakness in high yield credit was foreshadowed by weakness in the equities of high yield companies. This month’s 80bp widening in the CDX HY 5Y to 514bps was extreme relative to history; however, Exhibit 1 shows this move can be more than explained by the 25% decline in their corresponding equities (GSCBHY25) since April 1 and the large dislocation that had developed.

But.. There is reason for concern: A new dislocation in IG credit/equity
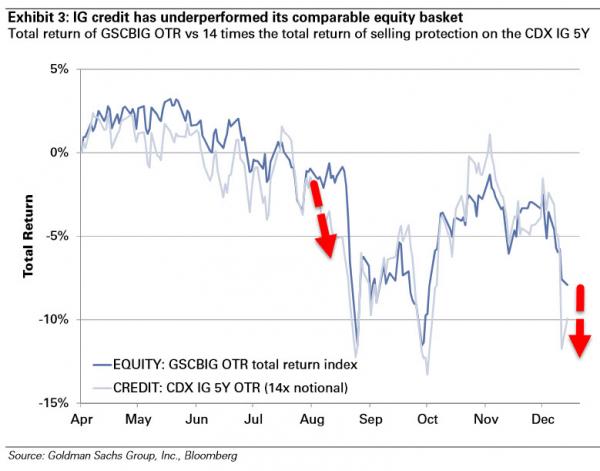
The weakness in Investment Grade credit spreads relative to their corresponding equities (GSCBIG25) represents a new divergence we are monitoring closely. In Exhibit 3, we show that after trading in line with each other for months, IG equities have outperformed IG credit by 4% over the past two weeks. This represents a 1.3 standard deviation divergence relative to the past five years. Due to the substantial overlap between names in the IG index and the S&P 500, we see this overvaluation in IG equity vs credit as meaningful for S&P 500 equity investors.

Finally, Goldman note that the cost of protection (on an apples to apples basis) is modestly higher in equity than it is in credit markets out to around 5 years…


Leave A Comment