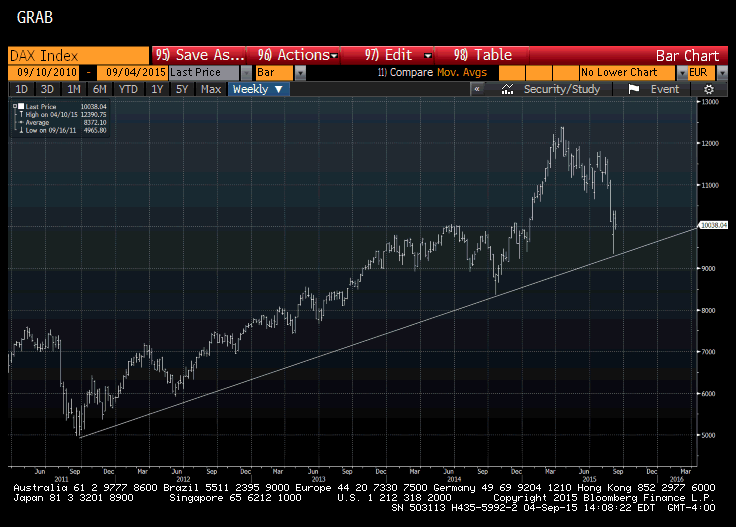
This Great Graphic is a weekly bar chart of the German DAX. It was created on Bloomberg, and tracks a three-point trend line going back to 2011. The recent sell-off marks the third point.
Click on picture to enlarge

Like other equity markets, it bounced off the August 24 exaggerated sell-off. However, this week it appears to have put in a double top near 10,380. A break of 9928 would confirm it. It would suggest a return to the spike low near 9338. This implies that the trend line may be penetrated. In turn this risks the triggering of another round of stops.
The possible demand for the euro emanating from this comes not from the safe-haven status that some claim for it. Rather it comes as part of the unwinding of what had been a very successful strategy earlier this year. It consisted of buy European assets and hedging the currency. As the assets are liquidated, intentionally or otherwise, the hedge is bought back. Another way this strategy was implemented was through borrowing euros, and using the borrowed euros to finance the purchases of a euro-denominated asset.
The DAX settled on its lows today. Given the sharp losses seen in North America, a gap lower opening on Monday is a distinct possibility. The US markets are closed on Monday, leaving ETF investors unable to react until Tuesday.


Leave A Comment