If the latest COT report for silver gets any more bullish than the one released on March 23rd, commercial traders will have to go ‘net long!’ As it is, they reduced their ‘net short’ position to the lowest number in many years, down to just 4,000 contracts – barely 2% of the total open interest! This is bullish action! As recently as January 16th the number of ‘net short’ positions was 50,000, and the percentage of open interest was 26%.(Charts are courtesy Goldchartsrus.com unless specified).
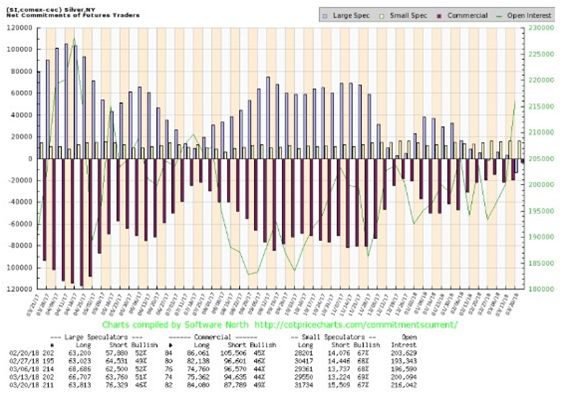
This chart courtesy [email protected], tells us is that commercial silver traders, such as bullion banks and silver miners, think the silver price has hit bottom, and is likely rise from here.
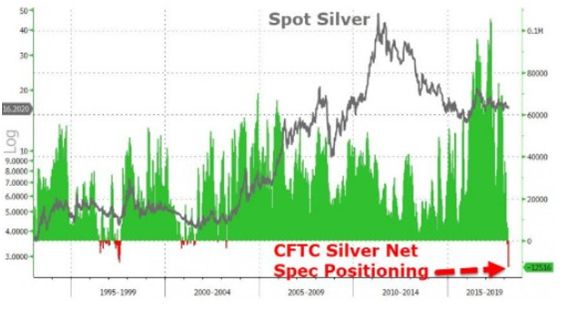
This chart courtesy Zerohedge.com shows silver speculators at the largest short position in at least 28 years. From a contrarian perspective this is very bullish.

This chart courtesy Goldswitzerland.com shows a bullish wedge formation is forming. An upside breakout will attract many buyers.

This chart courtesy Google.com shows ‘silver searches’ are beginning to rise up from a double bottom.

This chart shows the amount of silver bullion that is backing various trusts and ETFs, has been rising steadily for more than two years.
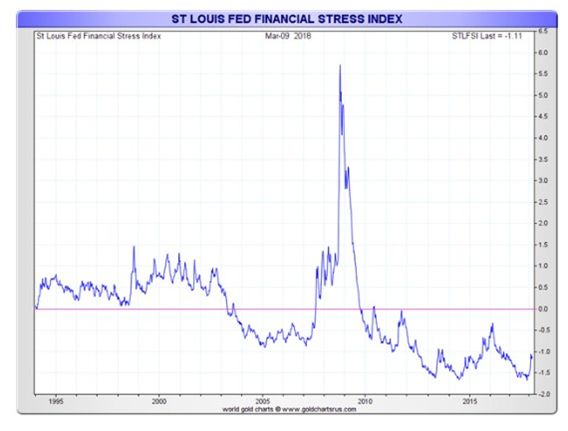
This chart shows the Fed’s Financial Stress Index is rising up from a triple bottom. During times of financial turmoil, investors tend to seek the safety provided by gold and silver.

This chart shows US money supply just keeps on rising.Newly printed money causes price inflation, providing energy for gold and silver to rise in price.
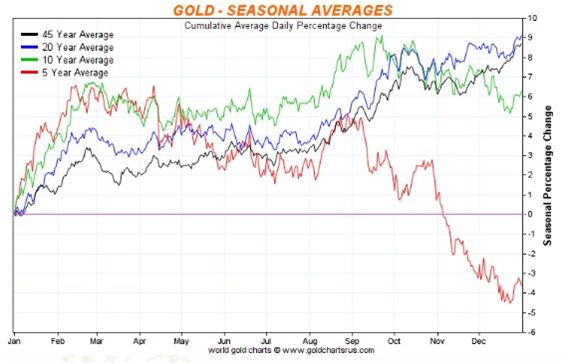
This chart shows the seasonal tendency for the gold price to consolidate after a dip in March, followed by a steady rise into October. (Disregard the red line which is dominated by a four year bear market).
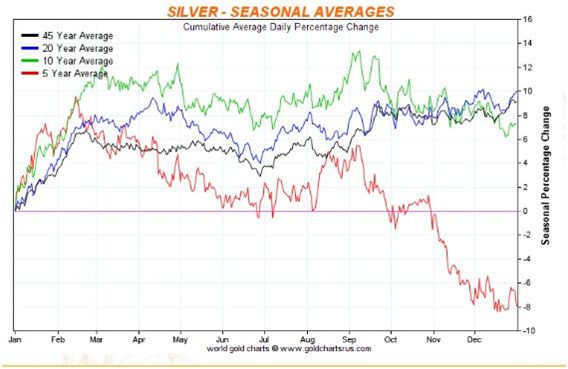
This chart shows the seasonal tendency for silver to provide buying opportunities during the spring season. These opportunities may not last long, if the latest COT report is any indication. (Disregard the red line as it is dominated by a 5 year bear market).


Leave A Comment