The median household is the statistical center of the Middle Class. In terms of income, this class has not fared well in recent decades. Let’s take a closer look at a troubling aspect of the Census Bureau’s latest annual household income data, issued last month.
We’ve already studied some key metrics in the annual release:
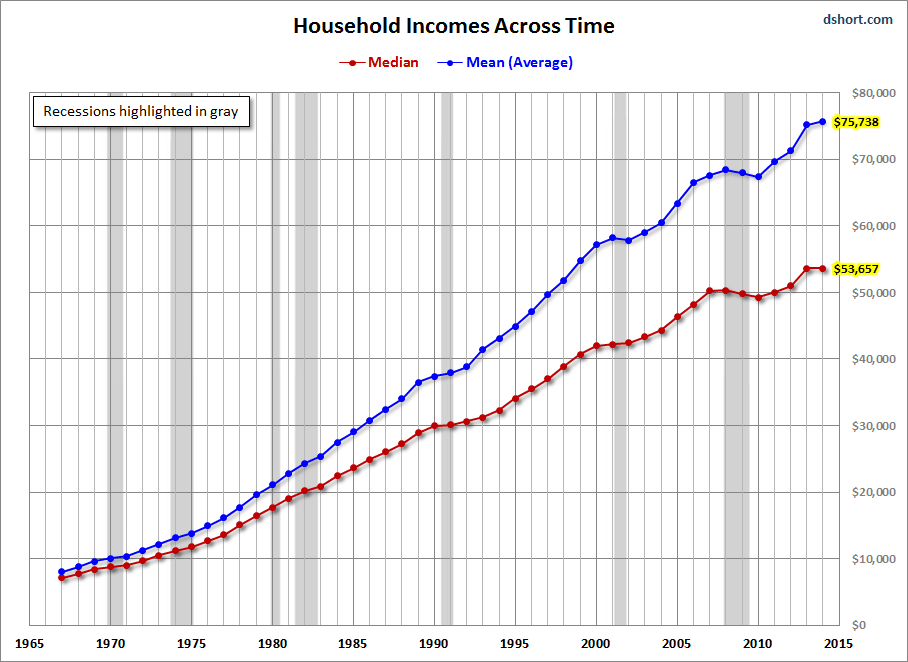
In this update we’ll focus on the growing gap between the median (middle) and mean (average) household incomes across the complete time frame of the Census Bureau’s annual reporting, which began in 1967, to the release last month of the annual data for 2014. Here is a snapshot the clearly illustrates the growing gap between the middle household and the average, which has been increasingly skewed higher by the far more rapid income growth of higher income households.

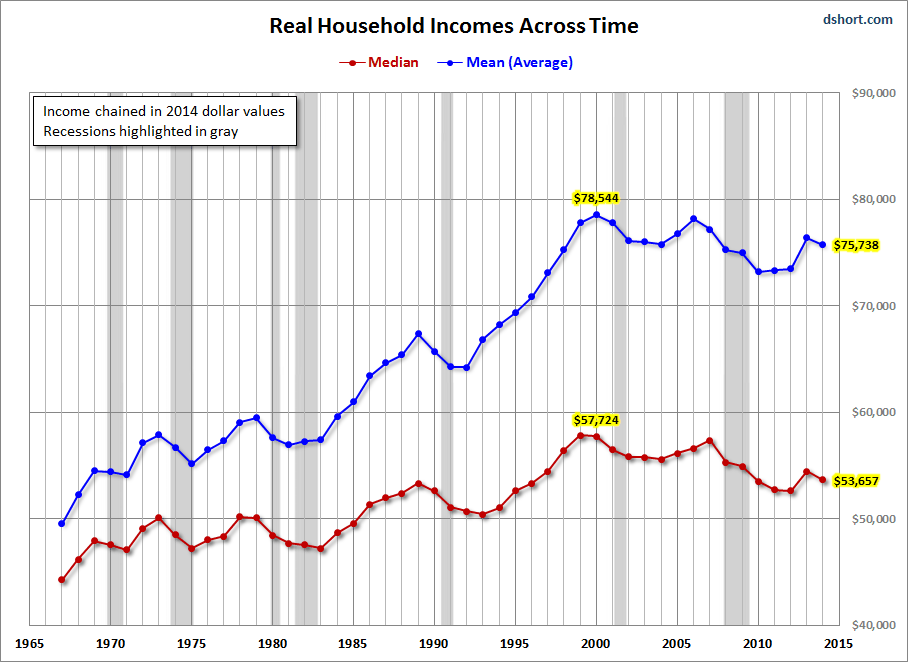
For a more realistic sense of the median-mean gap, here is the same chart adjusted for inflation based on the Bureau of Labor Statistics’ Consumer Price Index-Research Series (which we discuss in more detail Deflating the American Dream: Inflation-Adjustment). Among other things, we see that the 2014 incomes for both series are off their real highs, which was in 2000 for the average household and a year earlier for the middle household.

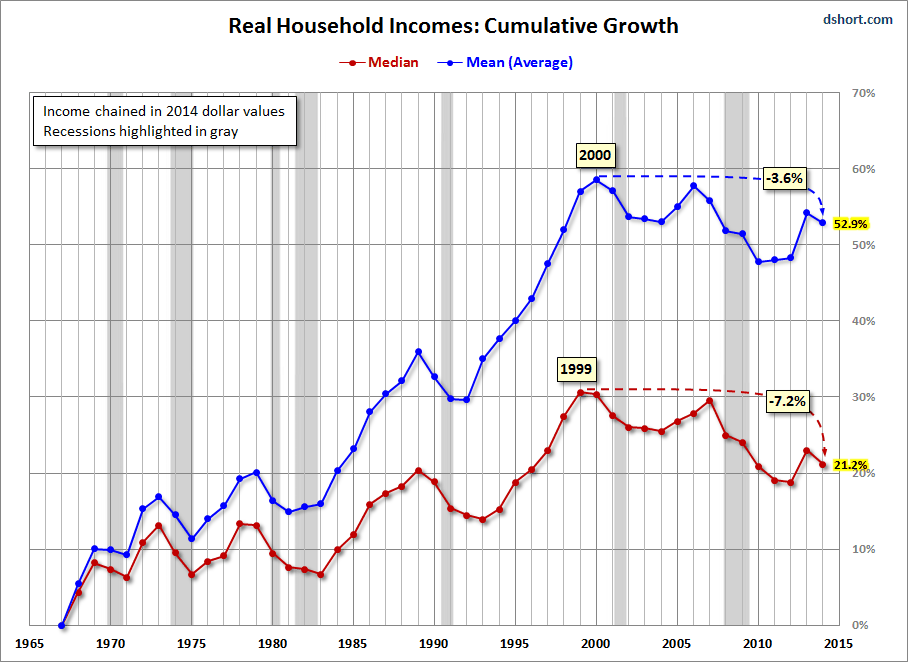
The next snapshot features an overlay the two series showing the cumulative growth of the two, which gives an even clearer sense of the widening gap. It also documents the erratic decline in real income growth during the 20th century.

The next chart is a calculation of the growing gap itself as the percentage spread between the two series. In 1967 the average household received about 12% more annual income than the middle household. In 2014 the spread had increased to 41%.

The inset in the chart above shows the Gini Index for all households. This is a more sophisticated to calculate the income distribution of households. We created the inset using the Census Bureau’shistorical data (see table H-4). Investopedia offers a concise explanation of the Gini Index:


Leave A Comment