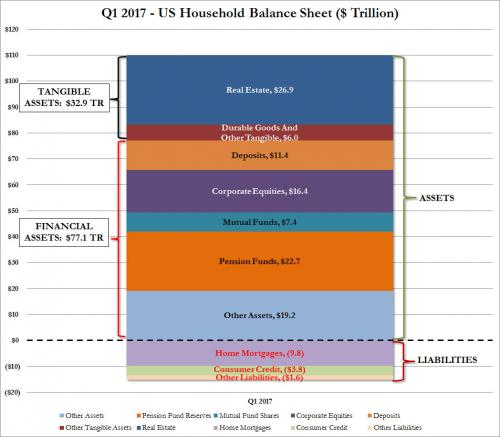
In the Fed’s latest Flow of Funds report, today the Fed released the latest snapshot of the US “household” sector as of March 31, 2017. What it revealed is that with $110.0 trillion in assets and a modest $15.2 trillion in liabilities, the net worth of the average US household rose to a new all time high of $94.835 trillion, up $2.4 trillion as a result of an estimated $500 billion increase in real estate values, but mostly $1.78 trillion increase in various stock-market linked financial assets like corporate equities, mutual and pension funds, as the stock market continued to soar to all time highs .
At the same time, household borrowing rose by only $36 billion from $15.1 trillion to $15.2 trillion, the bulk of which was $9.8 trillion in home mortgages.
The breakdown of the total household balance sheet as of Q2 is shown below.


And while it would be great news if wealth across America had indeed risen as much as the chart above shows, the reality is that there is a big catch: as shown previously, virtually all of the net worth, and associated increase thereof, has only benefited a handful of the wealthiest Americans.
As a reminder, from the CBO’s latest Trends in Family Wealth analysis, here is a breakdown of the above chart by wealth group, which sadly shows how the “average” American wealth is anything but.

While the breakdown has not caught up with the latest data, it provides an indicative snapshot of who benefits. Here is how the CBO recently explained the wealth is distributed:


Leave A Comment