The last Housing Market Review covered data reported in September, 2017 for August, 2017. At the time, I described a growing rift between the data and the stocks of home builders. Instead of stumbling, housing stocks received a fresh breath of life and kicked up the momentum another notch higher in October. The iShares U.S. Home Construction ETF (ITB) has not been this high since early 2007.

The iShares US Home Construction ETF is up a breathtaking 13.1% since it broke out to new highs in early September.
Source: StockCharts
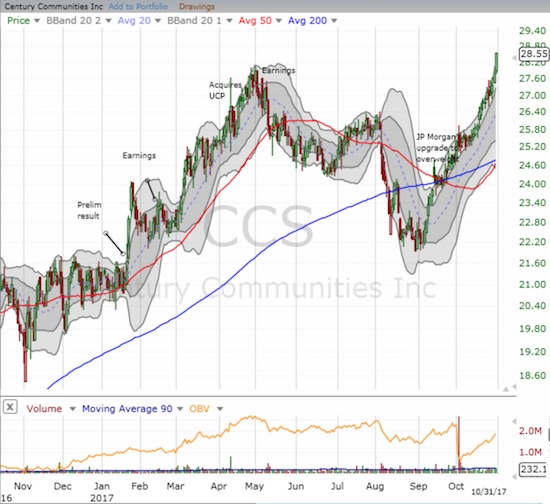
The rally in home builders is broad-based. The regional builders have benefited greatly. For example, Century Communities (CCS) quickly recovered from its struggles in August to now trade at a fresh all-time high. With hindsight, I clearly gave up on CCS too soon to lock in profits. More importantly, I can see now that the August dip was the opportunity to play the seasonally stronger period for housing stocks (November to spring).

Century Communities made an impressive recovery from August’s steep slide and the April/May peak.
Source: StockCharts
LGI Homes (LGIH) set new all-time highs throughout October. The stock is up 110% year-to-date!
While the stock gains are impressive and the earnings reports continue to look good, I cannot help taking a pause when looking at the macro-housing data. Price gains seem too relentless, existing home sales stand in stark contrast to soaring new home sales, and home builder sentiment is racing ahead of starts. This “curious” mix of data does not motivate me to chase after home builder stocks at current levels. So, for now, I am mainly observing the action. More on this in my concluding “parting thoughts.”
New Residential Construction (Housing Starts) – September, 2017
Single-family housing starts for August were revised upward from 838,000 to 869,000. September starts decreased month-over-month by 4.6% to 829,000. On an annual basis, single-family housing starts increased 5.9%, well below last month’s 17.1% year-over-year jump. These data bring the year-over-year gains back to a level last seen for February, 2017. Since then, year-over-year gains were at or close to double-digits.

Housing starts remain in an uptrend but the year-long cap means that the trend has slowed a bit.
Source: US. Bureau of the Census, Privately Owned Housing Starts: 1-Unit Structures [HOUST1F], retrieved from FRED, Federal Reserve Bank of St. Louis, October 22, 2017.
After three months of wide deviations, the regional changes were more uniform for the previous three months. Wide deviations returned for September with some impact from the hurricanes in the Southern region. The Northeast, Midwest, South, and West each changed 17.7%, 10.5%, -5.6%, and 26.1% respectively in September. For August these percentages were, respectively, 26.9%, -2.7%, 22.8%, and 14.6%. The strong starts in the West are quite consistent with the very bullish sales results reported from the West by KB Home (KBH).
Existing Home Sales – September, 2017
The routine description for existing sales is usually sales decline because of a shortage of inventory and sales increase in spite of inventory shortages. For September, 2017, hurricanes Harvey and Irma seemed to dampen sales but sales declined year-over-year in the Northeast and Midwest as well as the South. Moreover, during its conference call, the NAR noted a 4% year-over-year increase in sales in hurricane-impacted Houston. The NAR speculated that investors rushed in to buy distressed homes. Yet, this explanation was not available for Florida where existing home sales plunged 22% year-over-year.
Overall sales managed a small monthly increase and ended three straight months of declines. Since sales increased on a monthly basis, the boilerplate complaint from the NAR was couched in sales growth:


Leave A Comment