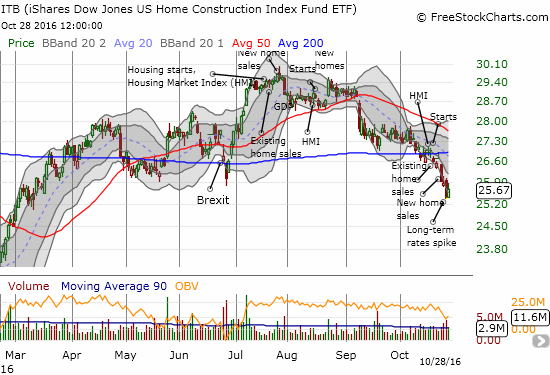
The last Housing Market Review covered data reported in September for August, 2016. At that time, iShares US Home Construction (ITB) started a notable divergence from the performance of the S&P 500 (SPY). That divergence widened in October with the S&P 500 losing 1.9% month-to-date and ITB tumbling 6.8%. The selling in ITB has been nearly relentless with two of the steepest losses occurring in the previous week. The steep drop in the wake of new home sales was the most ironic given those sales were the second highest in this post-recession period.

The iShares US Home Construction sagged to a 7-month low after a series of data followed the ETF through a 200DMA breakdown.
Home builder stocks seem weighed down most by the interest rate environment. In such an environment, all reported data looks very backward-looking and nearly irrelevant. The constant selling in October seemed to indicate as much. In the last month several indicators displayed some slowing yet home builder sentiment was strong. This time around, home builder sentiment dropped slightly while the data made some notable achievements.
New Residential Construction (Housing Starts) – September, 2016
After four straight months of downward revisions, housing starts for single-family homes finally received an upward revision. August’s privately owned 1-unit housing starts went from 722,000 units to 724,000. September starts increased 8.1% month-over-month and 5.4% year-over-year to 783,000. Single-family starts have not been this high since the surge in February, 2016.

Housing starts jump to their second highest level of the year.
Source: US. Bureau of the Census, Privately Owned Housing Starts: 1-Unit Structures [HOUST1F], retrieved from FRED, Federal Reserve Bank of St. Louis, October 29, 2016.
Starts increased year-over-year across all regions. Only the West fell month-over-month (2.2%). This unison is quite a contrast from the very mixed performance from August when only large gains in the South prevented overall housing starts from going negative. In other words, housing starts are back on track and mirroring the strong confidence of home builders (although still woefully lagging behind levels that National Association of Realtors would like to see!).
Existing Home Sales – September, 2016
July ended a four-month streak of gains for existing home sales and represented the first year-over-year decline since November, 2015 and only the second such decline in the previous 21 months. August delivered another monthly decline but resumed (marginally) the year-over-year gains. September put existing home sales on solid footing. The seasonally adjusted annualized sales of 5.47M were up 3.2% month-over-month from a downwardly revised 5.30M in sales for August. Year-over-year sales saw a gain of 0.6%.

Existing home sales rebounded strongly in September.
Source: National Association of Realtors, Existing Home Sales© [EXHOSLUSM495S], retrieved from FRED, Federal Reserve Bank of St. Louis, October 30, 2016.


Leave A Comment