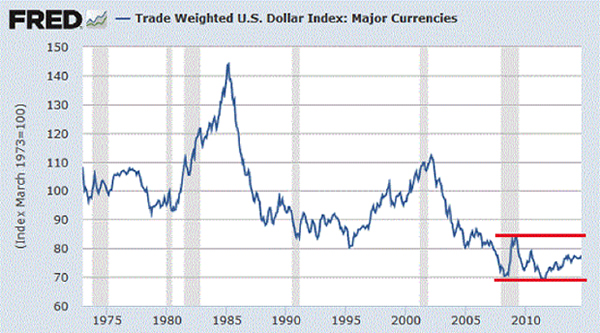
Let’s start our examination of the U.S. dollar (USD) by recalling the chart from my August 2014 essay, Why the Dollar Could Strengthen—A Lot. At that point, the USD had moved modestly off its lows, and had yet to challenge long-term resistance around 80.

Here’s the same chart of the Real Trade-Weighted U.S. Dollar Index now:

The USD broke out of its multi-year downtrend and soared above 100. Needless to say, the USD did in fact strengthen a lot. After that initial leg up, the dollar has remained in a consolidation range for much of 2015. Though it recently broke out of a wedge/triangle formation to the upside, it’s not yet clear if this is a definitive move higher or more consolidation.

Is the Dollar Rally Done?
So is the dollar rally done, or could it move higher?
The long-term chart above (Real Trade-Weighted U.S. Dollar Index) offers some clues.
Our first observation is that trends in the USD tend to last for some time, so if this rally follows the pattern of previous rallies, it’s unlikely to have run its course in one year.
Secondly, previous rallies paused for a multi-month consolidation period before launching upward for the second leg of the long-term rally.
Thirdly, the USD rose sharply to previous peaks and then round-tripped back to the 80 level.
This raises the question: How high could the dollar rise in this rally?
How High Could the USD Go?
How high could the USD rise before it tops out?Last November, when the dollar had just punched above 85 for the first time in years, I posted this chart that suggested 120 was “not impossible:”

The current rally has already made it halfway to this target (from sub-80 to 100+). If we look again at the FRED chart above (the current Real Trade Weighted Dollar Index), we see that the consolidation periods have occurred roughly mid-way in the rallies. This is supportive of the idea that the initial 20+ point advance could be followed (after the consolidation phase ends) by another leg higher of approximately the same size (20+ points).


Leave A Comment