The big economic news on Friday was the Department of Labor’s Employment Report for March. The mainstream press focused on two numbers: the 215K new jobs and the 5% unemployment rate. Over the next few days we’ll dig in a bit deeper to look at some of the underlying employment demographics, which in many ways give a greater understanding of employment conditions. But the much more significant economic news on Friday was the Federal Reserve’s noon release of the disturbingly negative annual benchmark revisions to Industrial Production.
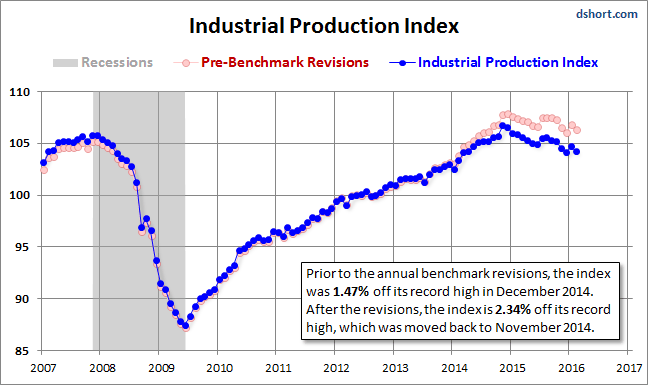
Industrial Production is one of the Big Four economic indicators we report on every month, along with Nonfarm Employment, Real Retail Sales and Real Personal Income (excluding Transfer Receipts). Industrial Production has been the weakest link, by far, in the economic recovery from the Great Recession. On Friday we learned that IP is even weaker than we thought. Here is a snapshot of the annual benchmark revisions with an overlay of the pre-revision data since 2007, which gives us a sense of pre-recession trend, the contraction, and the subsequent recovery for this key metric.

At this point in time, the post-recession recovery peak for this indicator occurred in November of 2014. The latest index level is 2.34% off that late 2014 peak an at a level below its pre-recession peak. We’re currently about where we were in February of 2007.
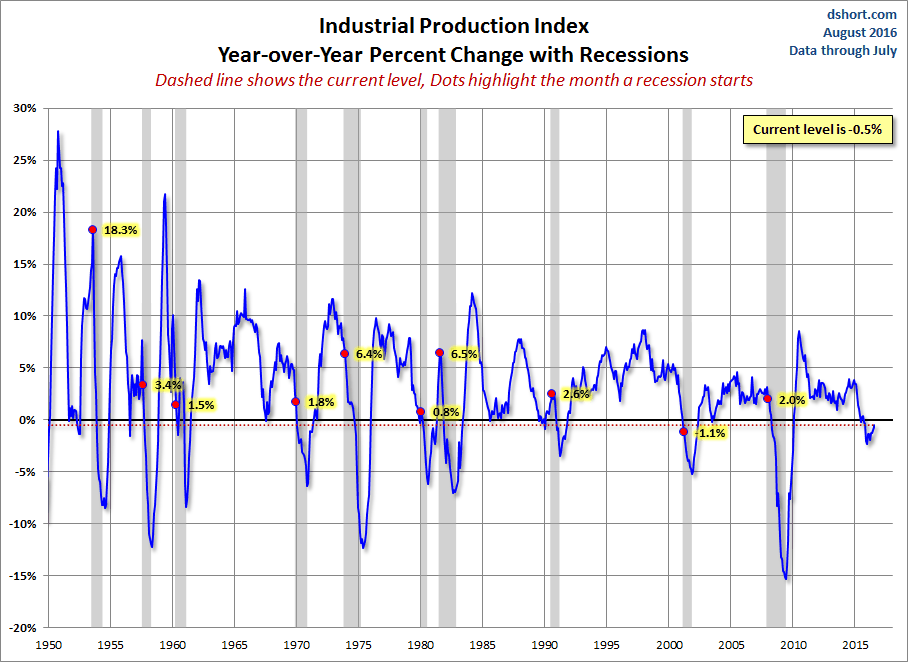
Here is a look at the year-over-year percent change in this indicator since 1950, updated with the latest annual benchmark revisions. We are now at a level lower that at the onset of all ten recessions over this timeframe.

If we study the chart above more closely, we see that the latest YoY level is fractionally off the interim low of -2.3% set two months earlier in December. This index has never been at that -2.3% level outside the context of a recession.
Here is an updated snapshot of the Big Four indicator we routinely track illustrating percent off their all-time high for the average of the four since before the last recession.


Leave A Comment