Originally appeared on Forbes on October 1, 2015.
The Dow Jones Industrial Average ended the first three quarters of 2015 in correction territory down 8.6% year-to-date and 11.3% below its all-time intraday high of 18,351.36 set on May 19. Six of the 30 Dow stocks ended September in bear market territory, down by more than 20% so far in 2015.
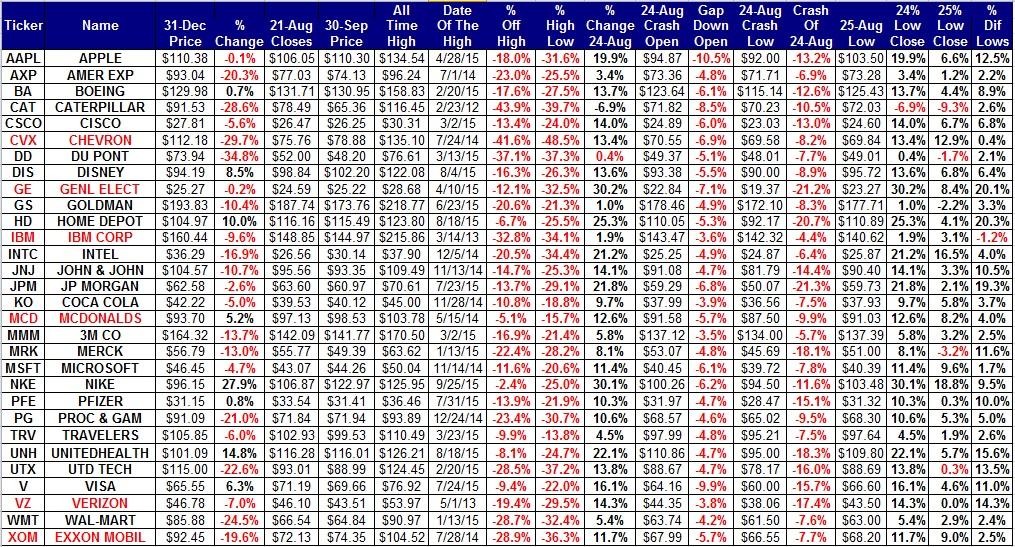
Here are the weekly charts for the six Dow stocks with the largest year-to-date pains.
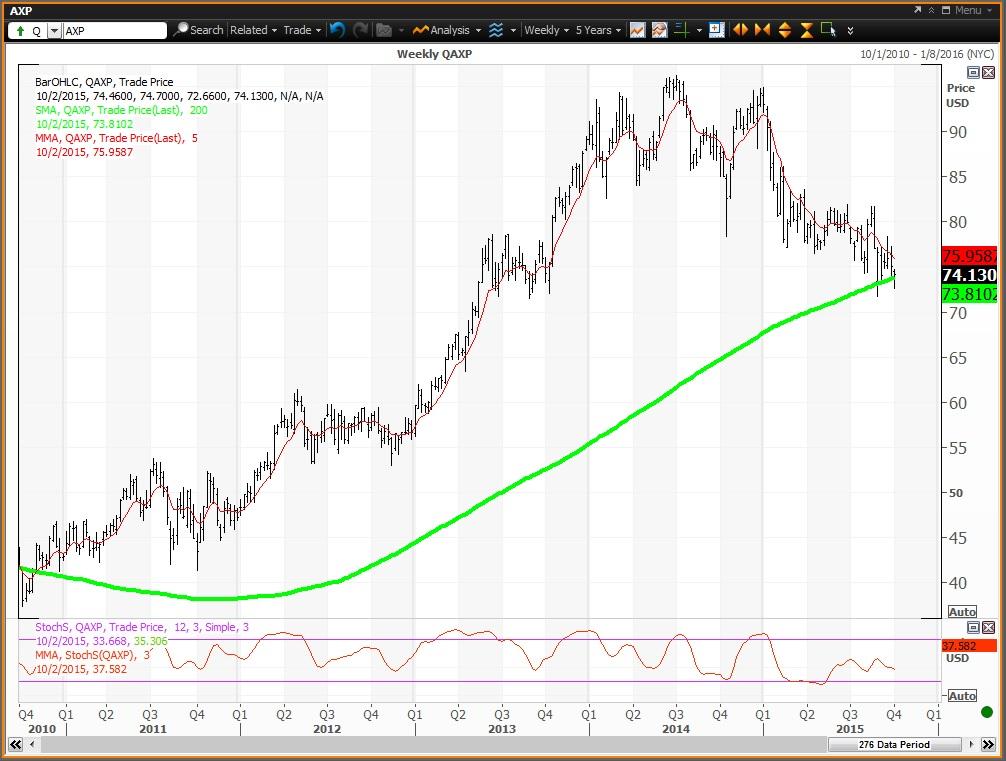
American Express closed at $74.13 on Sept. 30, down 20.3% year-to-date. The stock has been under a “death cross” since Feb. 3 when the stock closed at $83.73. By definition a death cross occurs when the 50-day simple moving average crosses below the 200-day indicating that further declines lie ahead. The 50-day and 200-day simple moving averages are now at $76.60 and $80.51, respectively.
Courtesy of MetaStock Xenith
American Express’ weekly chart is negative with the stock below its five-week modified moving average of $75.96 with its 12x3x3 weekly slow stochastic reading projected to decline to 37.58 this week, down from 39.54 on Sept. 25. The stock is just above its 200-week simple moving average at $73.81.
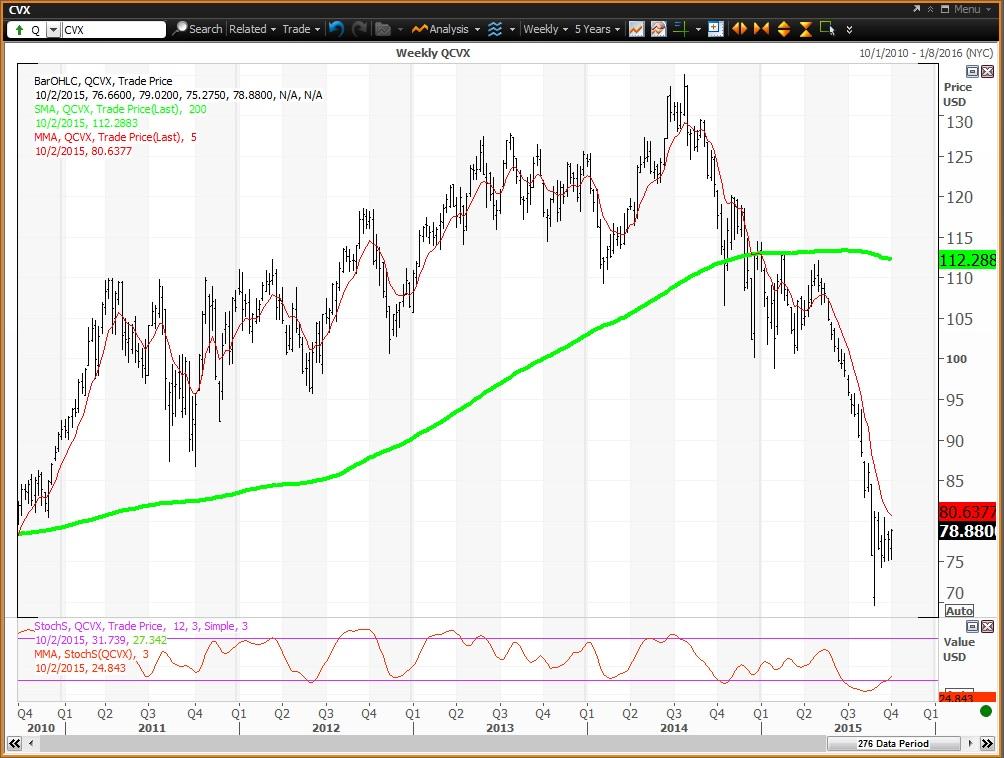
Chevron closed at $78.88 on Sept. 30, down 29.7% year-to-date. The stock has been under a death cross since Oct. 21 when the stock closed at $115.09. The 50-day and 200-day simple moving averages are now at $81.30 and $99.17, respectively.
Courtesy of MetaStock Xenith
Chevron’s weekly chart is neutral with the stock below its five-week modified moving average of $80.64 with its 12x3x3 weekly slow stochastic reading projected to rise to 24.84 this week, up from 21.40 on Sept. 25. The stock is well below its 200-week simple moving average at $112.29.
DuPont closed at of $48.20 on Sept. 30, down 34.8% year-to-date. The stock has been under a death cross since June 10 when the stock closed at $66.20. The 50-day and 200-day simple moving averages are now at $51.70 and $64.23, respectively.







Leave A Comment