The combination of several resistances turned out to be a too big challenge for the buyers at the end of the previous week, which resulted in a decline in the greenback on the following days. Does it mean that another profitable opportunity may be just around the corner?
EUR/USD and Bullish Formation


On Friday, we wrote the following:
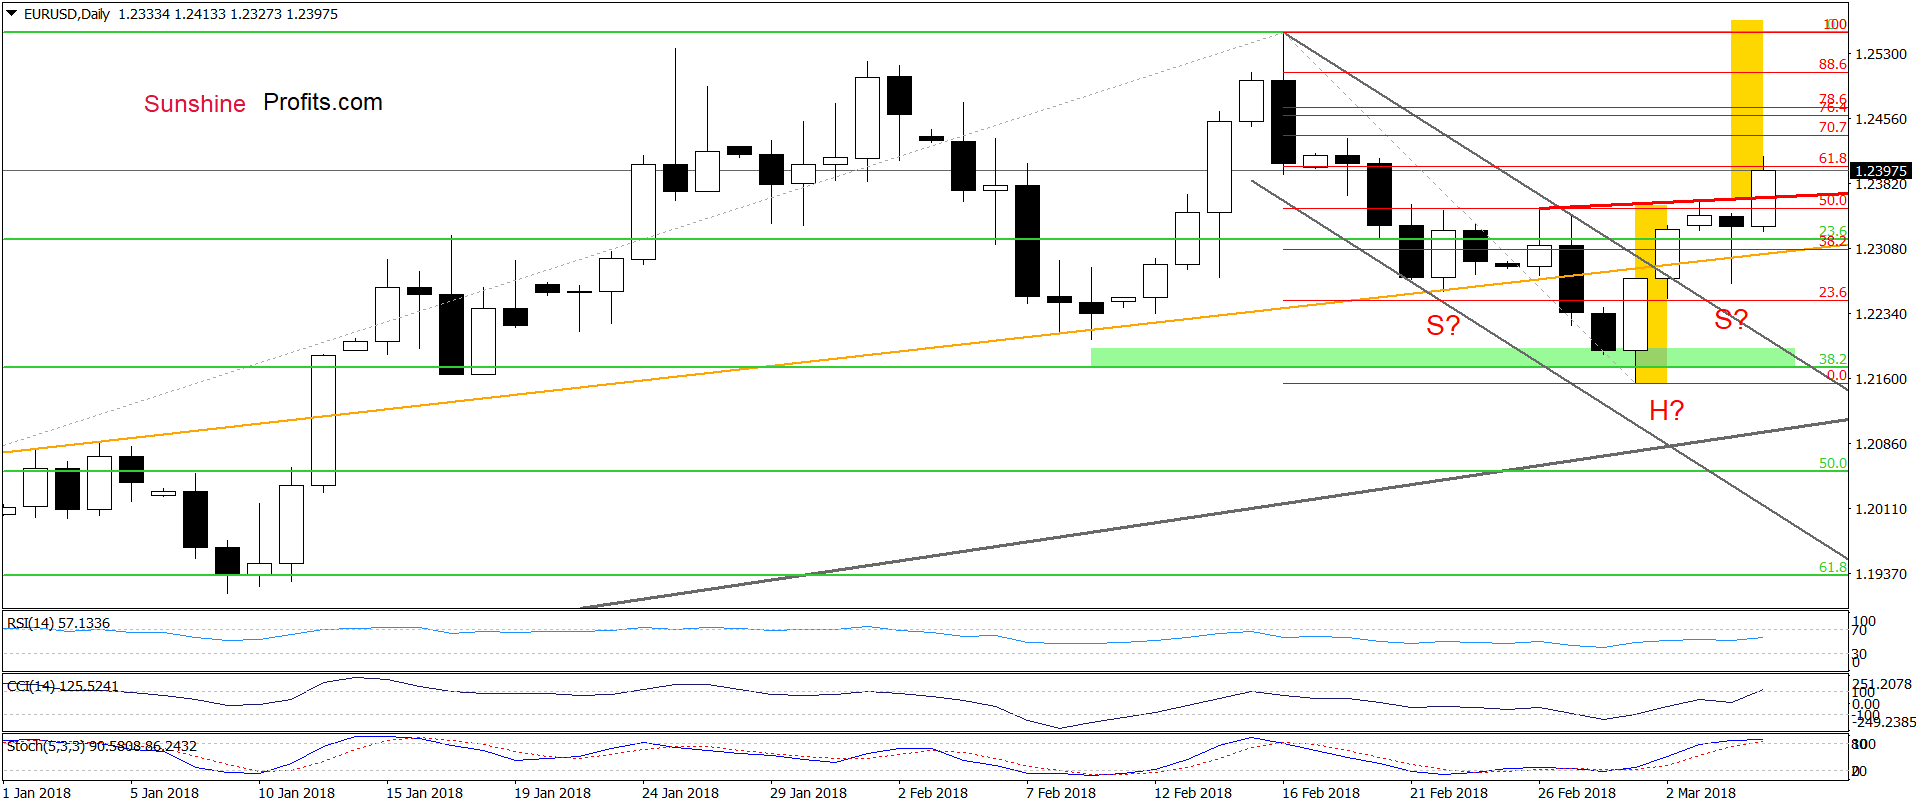
The first thing that catches the eye on the above chart is an invalidation of the tiny breakdown under the 38.2% Fibonacci retracement and the green zone. Yesterday’s white candlestick showed currency bulls’ strength, which resulted in two more improvements earlier today: a comeback above the orange resistance line (one more invalidation of the earlier breakdown) and a breakout above the upper border of the grey declining trend channel.
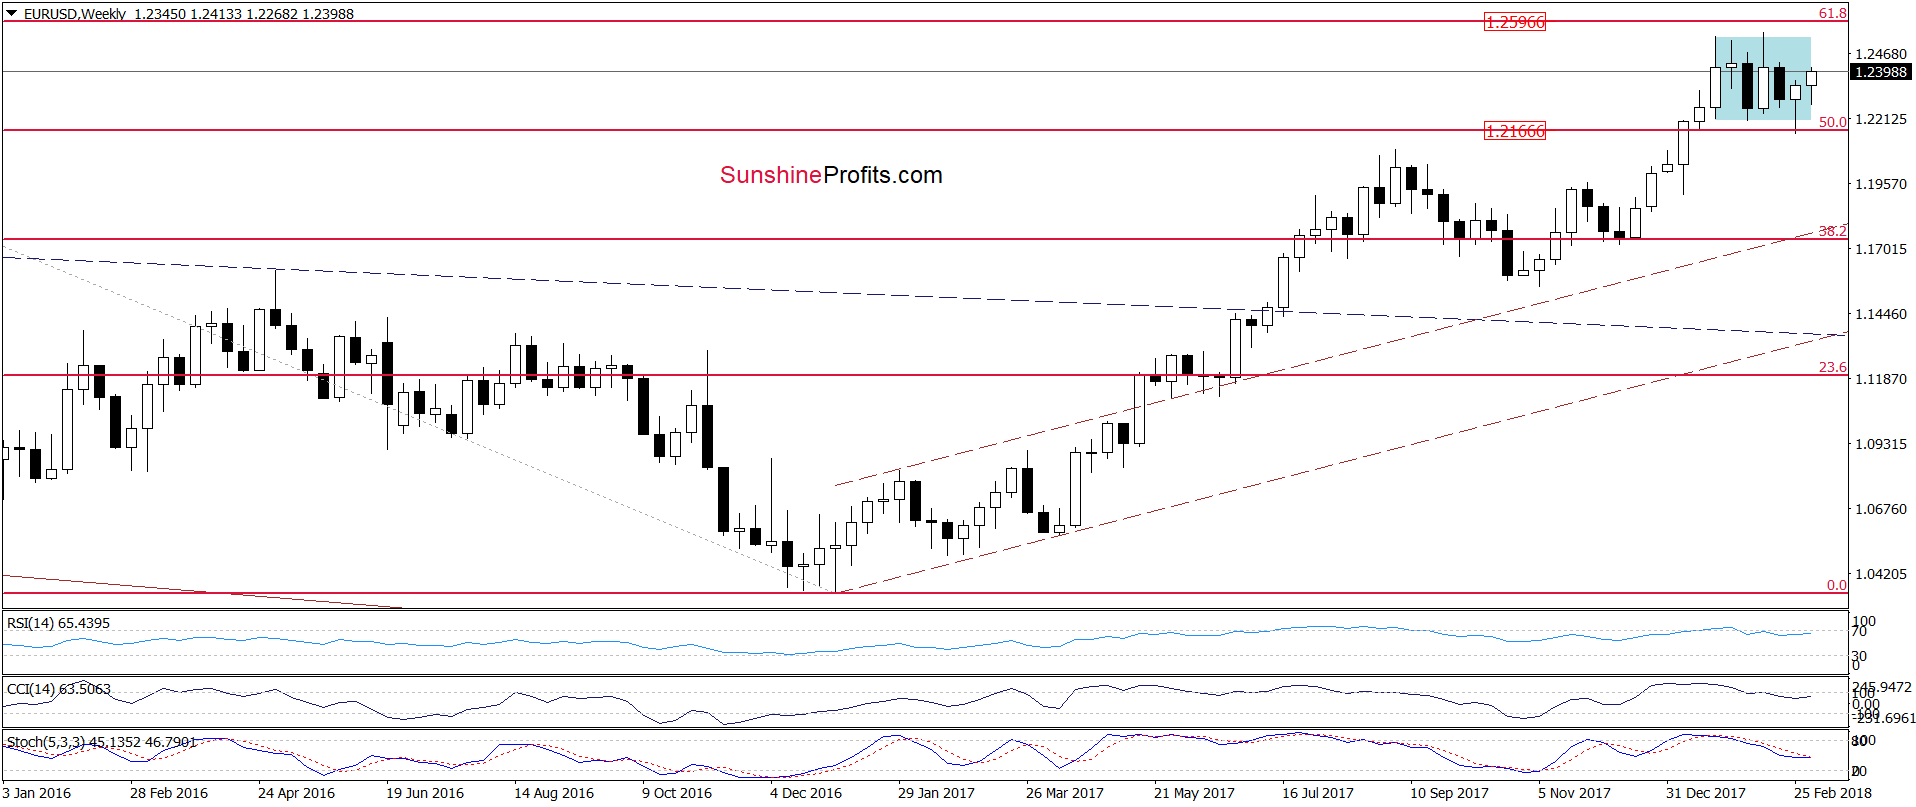
Additionally, the CCI and the Stochastic Oscillator generated buy signals, increasing the likelihood of further improvement in the coming days. On top of that, thanks to this rebound EUR/USD invalidated the earlier breakdown under the lower border of the blue consolidation (marked on the weekly chart below), giving currency bulls another reason to act.
Looking at the above charts, we see that the situation developed in line with the above scenario and EUR/USD extended gains earlier today. Thanks to today’s increase the pair broke above the red rising resistance line, which means that the reverse head and shoulders formation is underway. At this point, it is also worth noting that if we see a daily closure above this line (in this case, we’ll consider opening long positions), the bulls may even take the pair to the 2018 peak.
GBP/USD on Way to 1.4000

Quoting our On Friday on this currency pair:
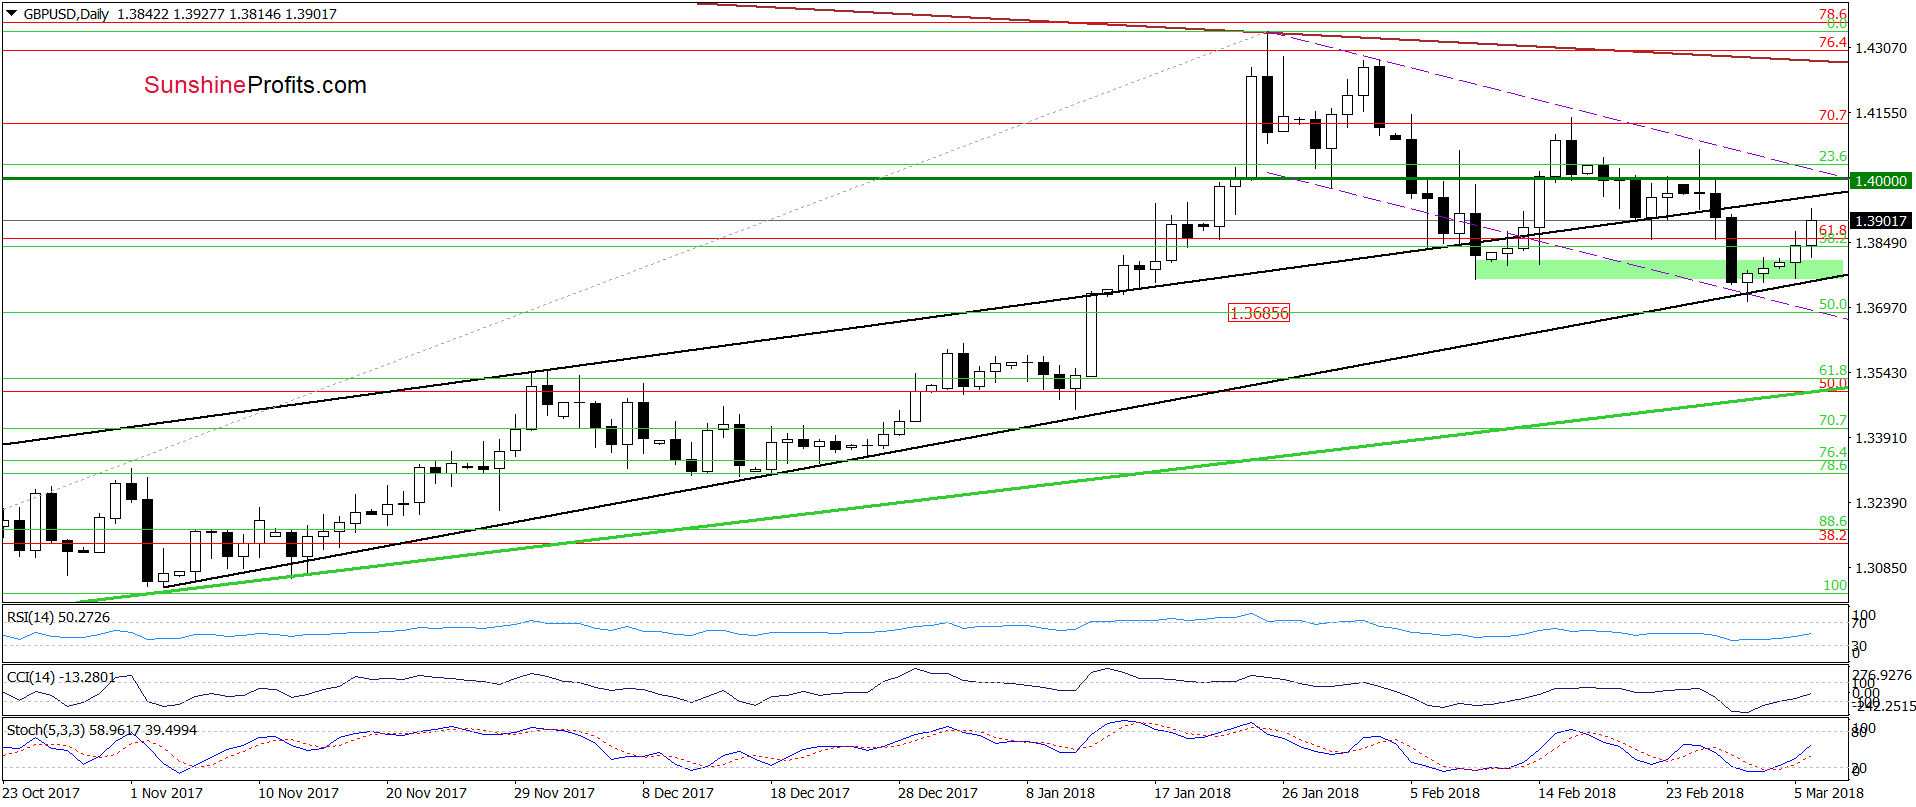
(…) the pair also slipped to the lower border of the purple declining very short-term chart, which increases the probability of rebound in the coming days – especially when we factor in the current position of the daily indicators (they are very close to generating buy signals).


Leave A Comment