Two of the primary drivers in the gold market are:
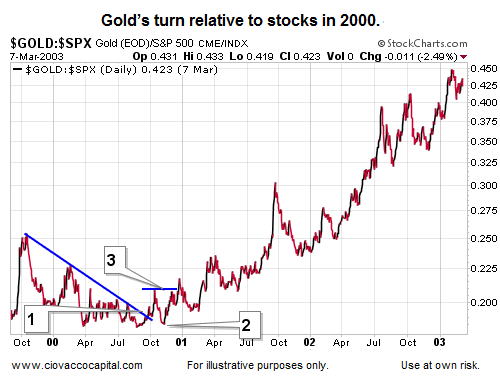
Gold is typically a leader or active participant during bull markets in stocks that feature leverage and rising/positive inflation. For example, gold completed the three steps for a bullish trend change relative to stocks in 2000.

2015: Are Inflation Concerns Rising Significantly?
If you were involved in the markets during the housing bubble bull market (2002-2007), you know the market’s leadership list had a much more inflation-oriented profile. For example, rather than lagging stocks, as it has done since 2011, gold was leading stocks between 2000 and October 2007. Therefore, it is fair to ask:
“Is the recent strength in gold signaling a return to more inflation-driven leadership in the financial markets?”
Gold Has Done Some Good Things
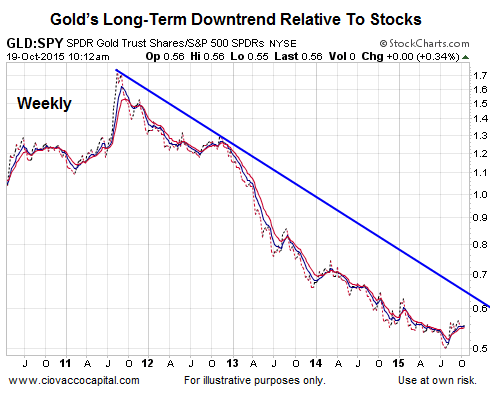
Gold (GLD) is on our 2015 radar due to recent signs of strength and interest from market participants. However, the previous statement must also be taken in the context of the long-term downtrend in gold relative to stocks.

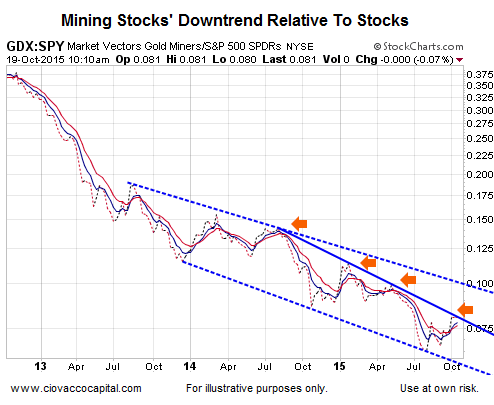
Gold mining stocks (GDX) have also shown some impressive strength recently. However, as shown in the chart below, GDX has made similar moves in the past within the context of a bearish relative trend (see orange arrows).

The orange arrows above seem to be leaning toward an answer to our primary question along the lines of:
Gold still has some work to do. The recent period of strength, thus far, looks similar to other periods of strength within the context of an ongoing downtrend. Said another way; so far, this looks like a countertrend rally on the chart of GDX relative to SPY. That may change soon, but we need to see more.
Stocks Will Continue To Impact Gold
Since the fears of a bear market in stocks can act as a bullish driver for safe-haven gold, a rational part of any analysis for the yellow metal should include the outlook for equities. This week’s video looks at the odds of stocks making new highs vs. the odds of stocks making new lows.


Leave A Comment