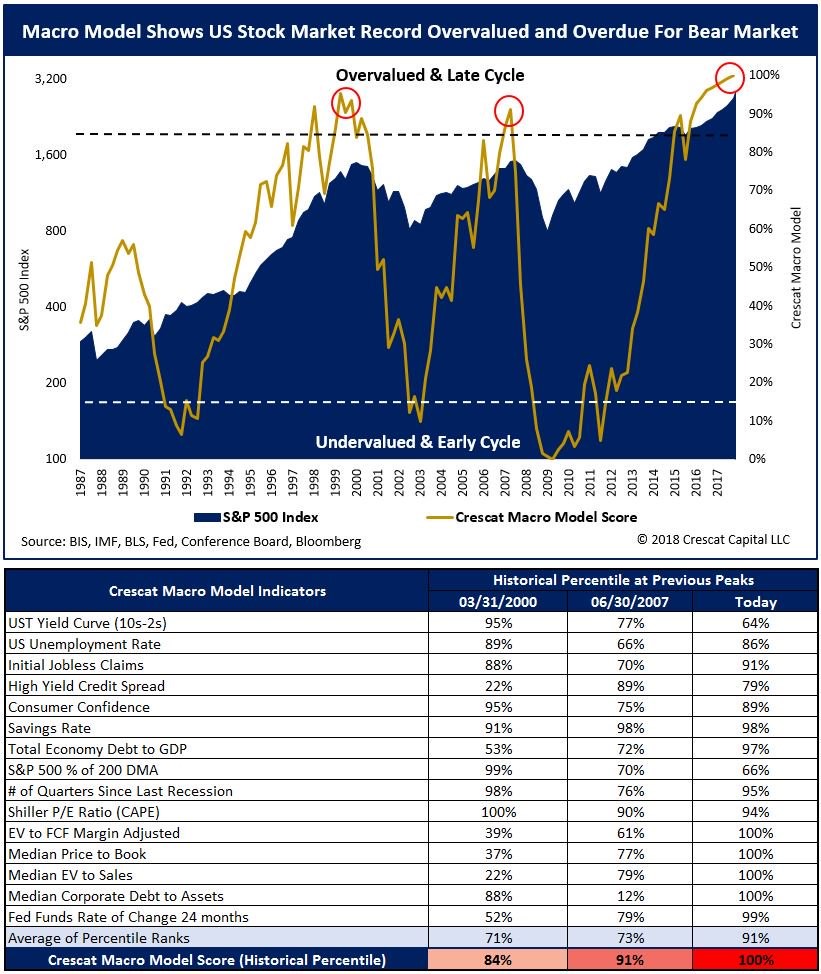
According to the RSI, the Dow was the most bullish since 1904 three days ago and it has been up since then. With records being topped, it’s interesting to see a comprehensive look at a bunch of indicators. The macro model below does just that as it shows the periods since 1987 which were overvalued and at the end of the cycle. As you can see, the average percentage the market has today is 91% which is higher than the 73% reading in 2007 and the 71% reading in 2000. I’m a bit suspect of an indicator which has the 2007 market riper for a correction than the 2000 market because the tech bubble brought valuations much higher. It seems like there was a false red flag in the 1990’s as well. Let’s review each indicator to see if this model has any value.

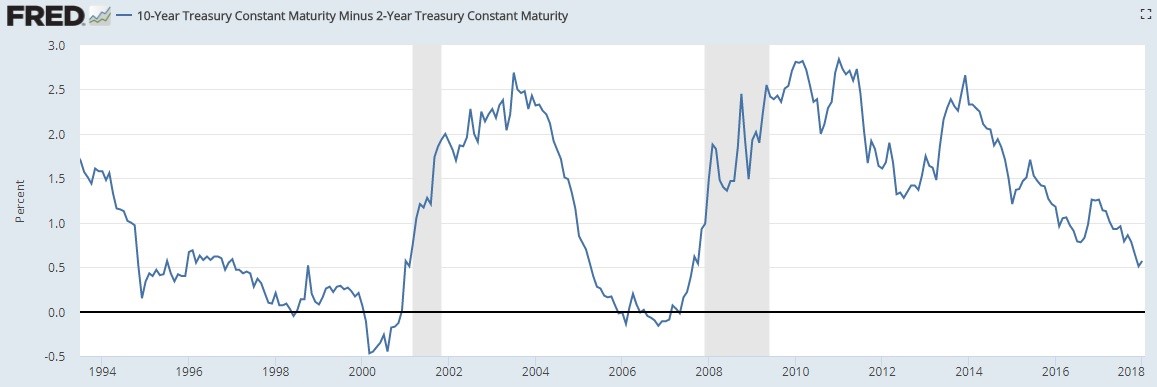
The first is the yield curve. This indicator is important, but this model looks at it completely wrong. In 2007, the yield curve was coming out of an inversion which is a recession signal. Currently, the yield curve is flattening, but it hasn’t inverted yet. The problem is taking a specific time and using it as an indicator without contextualizing the move. Therefore, this percentage is way too high. With the yield curve at 57 basis points without inverting yet, it’s saying we’re 2-4 years away from a recession.

The second and third indicators are the unemployment rate and the jobless claims. As you can see, the jobless claims indicator is flashing the worst warning signal of the three points because it’s at the lowest amount since the 1970’s. The unemployment rate signal is the worst since the 2000 indicator because the unemployment rate is the lowest since the 1990’s. I disagree with these being timing indicators because they don’t measure the slack in the labor force accurately. Keep in mind, these metrics only become a problem when they start getting worse. Until then, they are not flashing warnings signs. The latest jobless claims report showed 233,000 claims which was in the range I previously mentioned they would be in (230,000 to 250,000). This was a 17,000 increase from last week and 7,000 below the estimate. Last report was artificially low because many states were estimated. This week only Maine was estimated. I think the volatility in the report is over because the weather is relatively normal and there aren’t any holidays on the horizon. The report still shows the labor market is strong, so recession fears must be pushed back a few quarters.


Leave A Comment