February volatility has clearly signaled a regime change. We’re no longer in a market that rewards ‘hodlers’ to think less and hold more. It’s a traders market now.
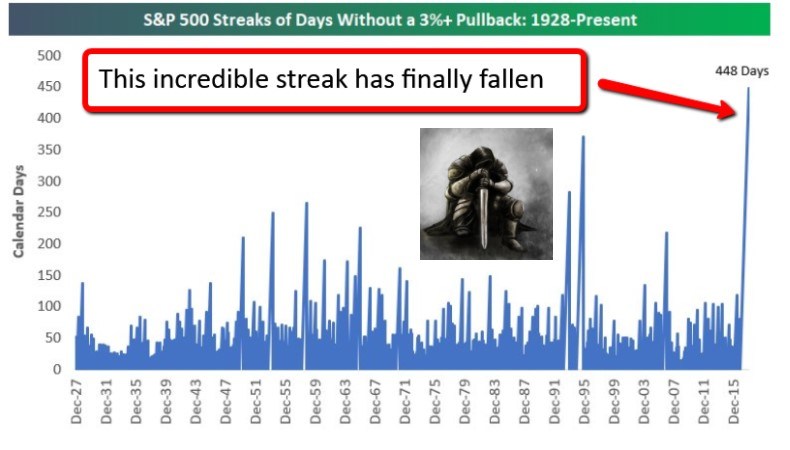
The S&P finally snapped that ridiculous no pullback streak we’ve all been watching on Fintwit. (Picture below via Bespoke.)

And that break caused the largest short volatility unwind in the history of the VIX complex. The one day move on February 5th set records for the largest point move and percentage move in the VIX index. This includes data from the 2008 financial crisis.

This up move caused the VIX futures term structure to trade at levels last seen in the 2008 financial crisis.

Now the big question is whether or not this volatility will persist. Will equities work off the uncertainty and resume the 2017 uptrend? Or will 2018 look like a giant volatile and choppy range?
We’ve found it extremely helpful to watch the trend in credit spreads to determine the forward vol regime. When credit spreads widen volatility in the market will persist and stay high. When credit spreads tighten the opposite occurs — volatility comes down.
A quick way to check out credit spreads is to plot the ratio between SHY and HYG (SHY/HYG).

Credit spreads are on the precipice of breaking out and reversing the downtrend from 2015. If this chart can breakout and hold then we should expect more volatility in the months ahead.
Right now it’s sort of in “no-man’s land.” In response, we’ve cut back on our aggressive short vol stuff and have started to move our focus into trades that will benefit if this chart breaks out. This is in line with our macro view that higher volatility is ahead.
Unfortunately, monetizing a forecast for higher volatility is tough. Pretty much anything that benefits from higher vol has a negative carry along with it (short high yield bonds, long VIX calls, long puts on SPX, long VXX etc.). All of these long vol trades slowly bleed you to death unless you happen to get in at the perfect time. It’s possible to do — but tough.


Leave A Comment