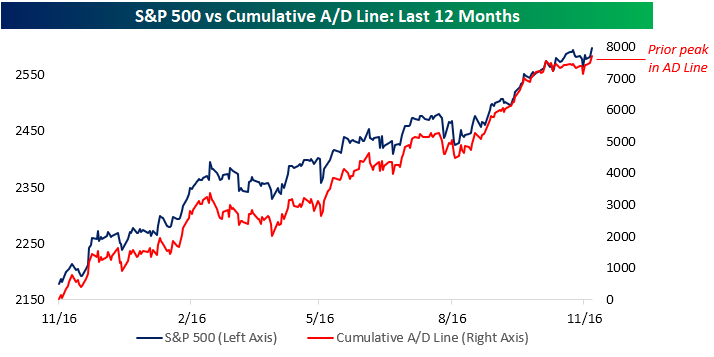
For more than a year now, we have repeatedly highlighted how the S&P 500’s cumulative A/D line has consistently confirmed each new high in the S&P 500. For those unfamiliar with the term, the cumulative A/D line is simply a running total of the net number of S&P 500 components rising in price (stocks trading up on the day minus stocks trading down) each day. When the market is rising, the cumulative A/D line, or ‘breadth’ as its often referred to, should be rising, and when the market is falling, the opposite should be the case. The chart below compares the two over the last year, and it’s easy to see how closely the two have tracked each other over time. That’s a sign of a healthy market.
In the last month, however, we did see a slight divergence between the S&P 500 and its cumulative A/D line. Prior to Tuesday’s trading, the last time the S&P 500 saw breadth reach a new high was more than a month earlier on 10/20. Despite the lack of a new high in breadth, the S&P 500 managed to post four closing highs during that span. Now, while there was technically a divergence between price and breadth, the difference was extremely minor, but big divergences have to start somewhere. Therefore, we were tracking it closely. When it comes to this indicator, though, there’s a lot less to worry about after Tuesday’s trading. That’s because the S&P 500 finally took out its cumulative A/D line as the index itself closed at another new all-time high just shy of 2,600. We’re thankful that breadth finally caught up.


Leave A Comment