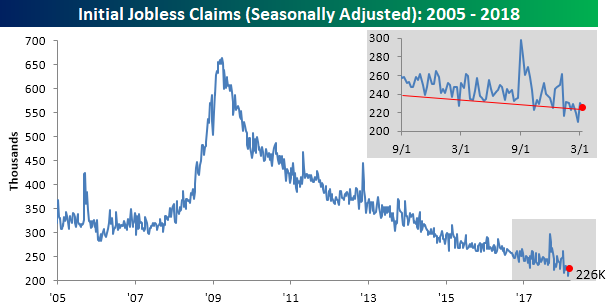
Whenever you’re talking markets and charts, the last thing a bull wants to hear is the word downtrend. That is unless it relates to weekly Jobless Claims, and in the case of this indicator, they remain stuck in one of the most prolonged downtrends any of us will ever see. In this week’s report, first-time claims came in at 226K compared to expectations for 228K and last week’s level of 230K. This is the 9th straight week that claims have been below 250K, which is the longest streak since 1973. More importantly, though, it is the 158th straight week where claims have come in below 300K. Three years ago, it was considered an extraordinary accomplishment for the economy that claims dropped below 300K. Now, we’re just three weeks away from tying the longest streak of sub 300K readings ever!

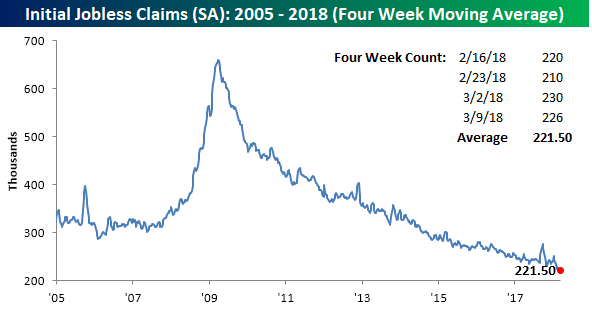
The four-week moving average also saw a slight decline this week, falling to 221.5K from 222.25K. That’s just 1K above the multi-decade low of 220.5K that we dropped to in the last week of February.

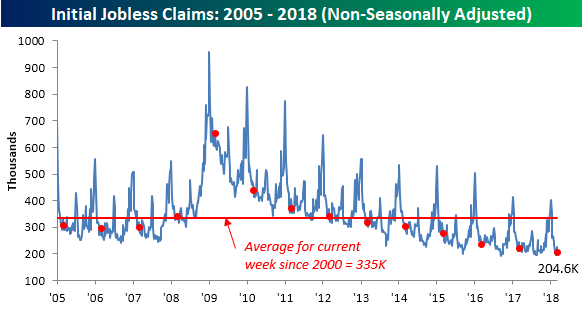
On a non-seasonally adjusted basis (NSA), claims almost dropped below 200K, falling from 225.5K down to 204.6K. For the current week of the year, this is the lowest weekly print since 1969, and it is also more than 130K below the average of 335K for the current week of the year dating back to 2000.


Leave A Comment