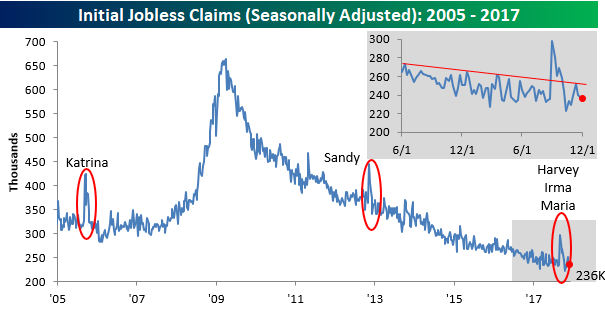
Jobless claims saw a slight decline this week, falling from a seasonally adjusted level of 238K down to 236K, but given that consensus forecasts were looking for a slight increase to 240K, it was better than expected. This week’s reading also represents the 144th straight week where jobless claims have been below 300K, which is the longest streak since April 1970 when claims were below 300K for 161 straight weeks.In order to break that record, claims will need to come in below right up through the end of Q1.

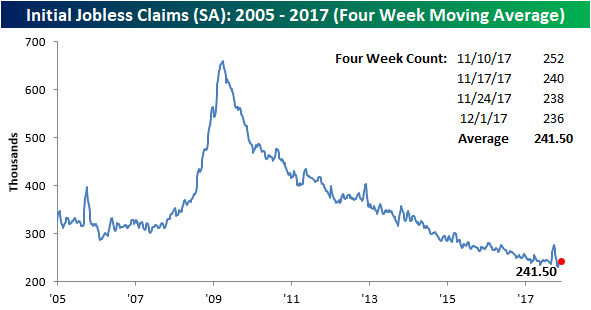
With this week’s slightly lower weekly print, the four-week moving average also declined slightly from 242.25K down to 241.5K. That’s slightly more than 10K above the multi-decade low of 231.25K reached back in early November.

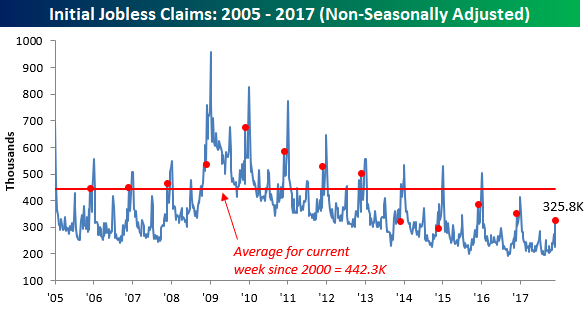
On a non-seasonally adjusted basis (NSA), jobless claims spiked up by more than 100K to 325.8K from 224.9K. That sounds like a big move, but if you look at the chart, big increases are common on a non-seasonally adjusted basis at this time of year.In fact, this week’s print is more than 100K below the post-recession average of 442.3K.


Leave A Comment