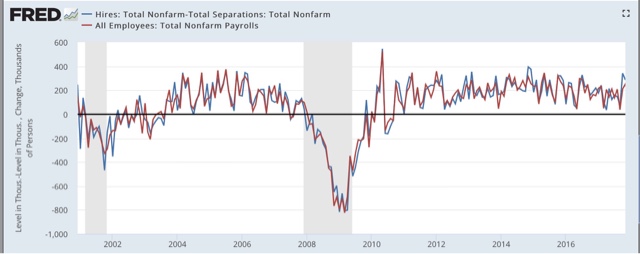
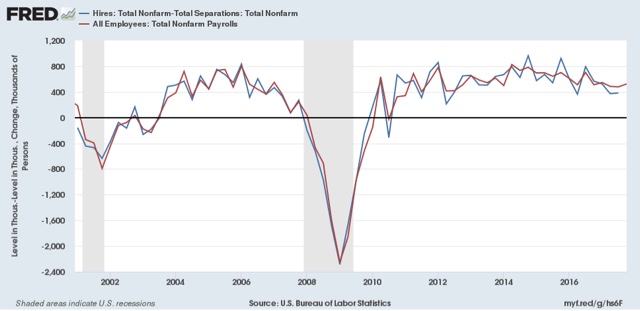
I’’m changing my presentation of JOLTS data somewhat compared with the last year or two. At this point I’ve pretty much beaten the dead horses of (1) “job openings” are soft and unreliable data, and should be ignored in contrast with the hard “hires” series; and (2) the overall trend is that of late expansion but no imminent downturn. So let’s start a little differently, by comparing nonfarm payrolls from the jobs report with what should theoretically be identical data: total hires minus total separations in the JOLTS report, monthly (first graph) and quarterly (second graph):


While there can be a considerable disparity in any one month, once we start looking longer term there is an incredibly tight fit.
For our immediate purposes, it’s likely that the strength in the JOLTS hiring data over the last several months is the same trend as the very good post-hurricane October and November jobs reports, both of which showed that more than 200,000 jobs had been added. While any given month can be off significantly, it’s a fair bet that when the December JOLTS report is released in one month, it too will be weaker, just as was the December jobs report.
Next, my mantra is that hiring leads firing, so that part of the presentation is still important. To reiterate, the major shortcoming of this report is that it has only covered one full business cycle. In that cycle, in accord with my mantra, hires peaked and troughed before separations:

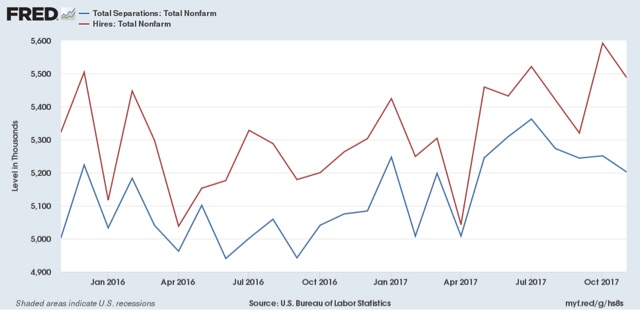
Here’s what this data looks like monthly for the last 24 months:

Just as at the bottom of the Great Recession, at the end of the “shallow industrial recession” of 2015, hiring (red) troughed first, followed later in 2016 by separations (blue). With hiring up, I expect the level of separations to also increase (note some of these are voluntary) in the next few months as well.
Further, in the previous cycle, after hires stagnated, shortly thereafter involuntary separations began to rise, even as quits continued to rise for a short period of time as well:


Leave A Comment