Using a simple cumulative average: as opposed to a simple moving average to compare the period in question (usually the current market, or a recent possible major low or high) with the prevailing trend or correction.
Definition:
Average of all closing prices from a designated starting point, which accumulates over time, as opposed to a simple moving average which averages the closing prices of a designated fixed period of time.
Purpose:
To compare any period with the average of an entire preceding trend, of all closing prices that occurred prior, usually starting from an important low or high. This compares the period in question (usually the current market, or a recent possible major low or high) with the prevailing trend or correction can help identify entry points and lows and highs in an uptrend.
Uses:
Examples:

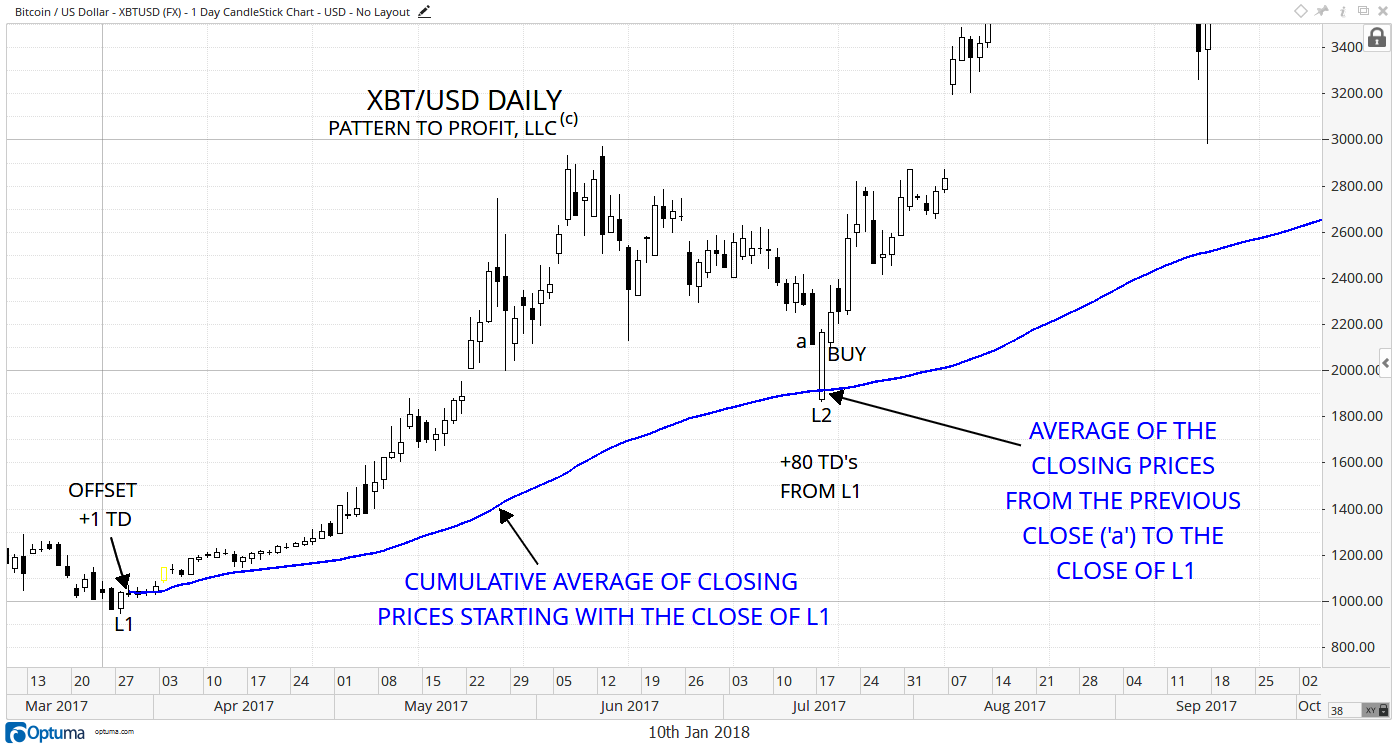
A simple cumulative average is plotted (using a customized tool in the Optuma platform) starting from the close of the low (L1). The value of the cumulative average during the period labeled L2 offered the average of all closing prices that occurred previously starting with the close of the uptrend low (L1).
The average is offset +1 period (‘TD’, or trading day), which allowed for the market at L2 to have this fixed value of potential support directly underneath.
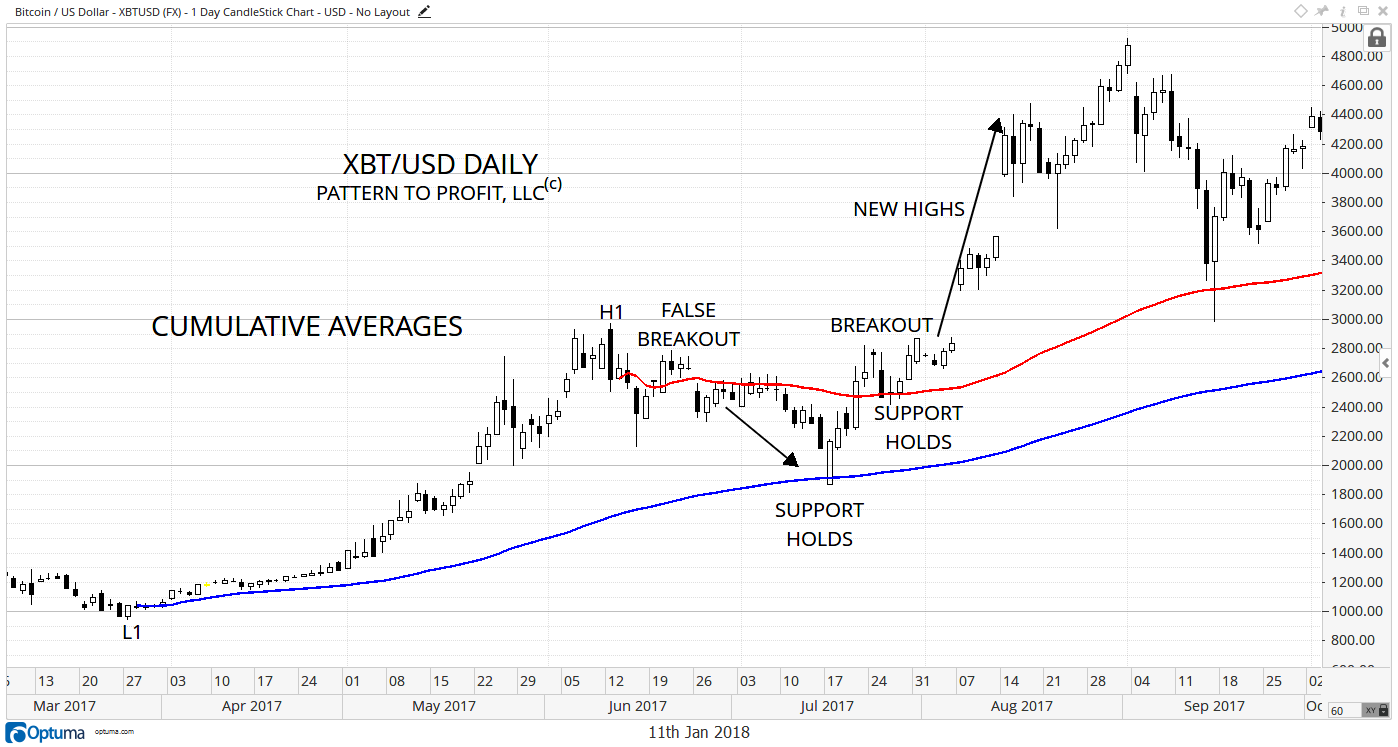
This next chart adds a cumulative average to the high at H1 (red):

Although support holding on the blue cumulative average offers an ideal aggressive long entry, a successful breakout above the red cumulative average from the high (and subsequent support) offers confirmation of the resuming uptrend, and a more conservative long entry.


Leave A Comment