Back in June, Deutsche Bank’s Aleksandar Kocic set out to quantify complacency. While there’s certainly been no shortage of commentary containing the term “complacency” from analysts and pundits, the idea of putting a number on it was new.
Kocic’s approach was relatively straightforward and his note (which you can read in the linked post above) explaining the rationale and method was characteristically brilliant. Here’s an excerpt:
We approach the problem of quantifying complacency … by comparing the two different measures of economic uncertainties: Economic policy uncertainty index and VIX (implied S&P volatility).
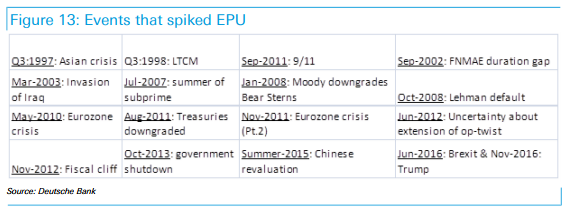
Until 2012, for the most part (but not always) both levels and spikes tend to be coordinated across two measures. When VIX is in tune with EPU, the market is acknowledging the levels of risk through the prices. When VIX is low and EPU high, markets are complacent – they are underpricing risk. Spikes across different events are summarized in the Table (chronologically, from left to right). After 2011, the two measures of risk decouple with VIX consistently low despite growing uncertainty. The breakdown is structural, and it is visible across all market sectors, not only equities.

In order to quantify market complacency, we compare the two measures in the following way. We regress EPU onto VIX until 2011 und treat the residuals as the measure of complacency. The two Figures show the EPU index overlaid with the regression scaled VIX and the residuals.

OK, so that was in late June.
Fast forward a couple of months and although the VIX has seen episodic spikes tied directly to the things that come out of Donald Trump’s mouth, things are still relatively calm and this morning’s risk-off mood notwithstanding, Tuesday’s price action seems to suggest that the BTFD, “mean reversion” regime remains deeply entrenched.
That said, you might be tempted to think that the residual on the EPU onto VIX regression would be rising given the fraught geopolitical and policy backdrop.


Leave A Comment