The China Labour Bulletin website provides maps displaying incidents of labour strikes that have occurred in recent years. While of course these should be viewed with a hefty grain of salt, they may be worth scrutinizing all the same.
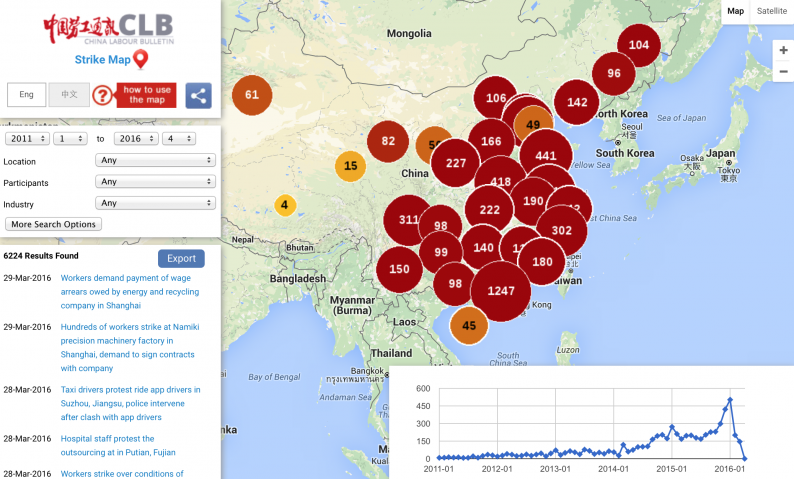
This image below shows the number of strikes in general that have occurred since 2011; as you can see, they have been becoming a lot more common since the beginning of 2014.
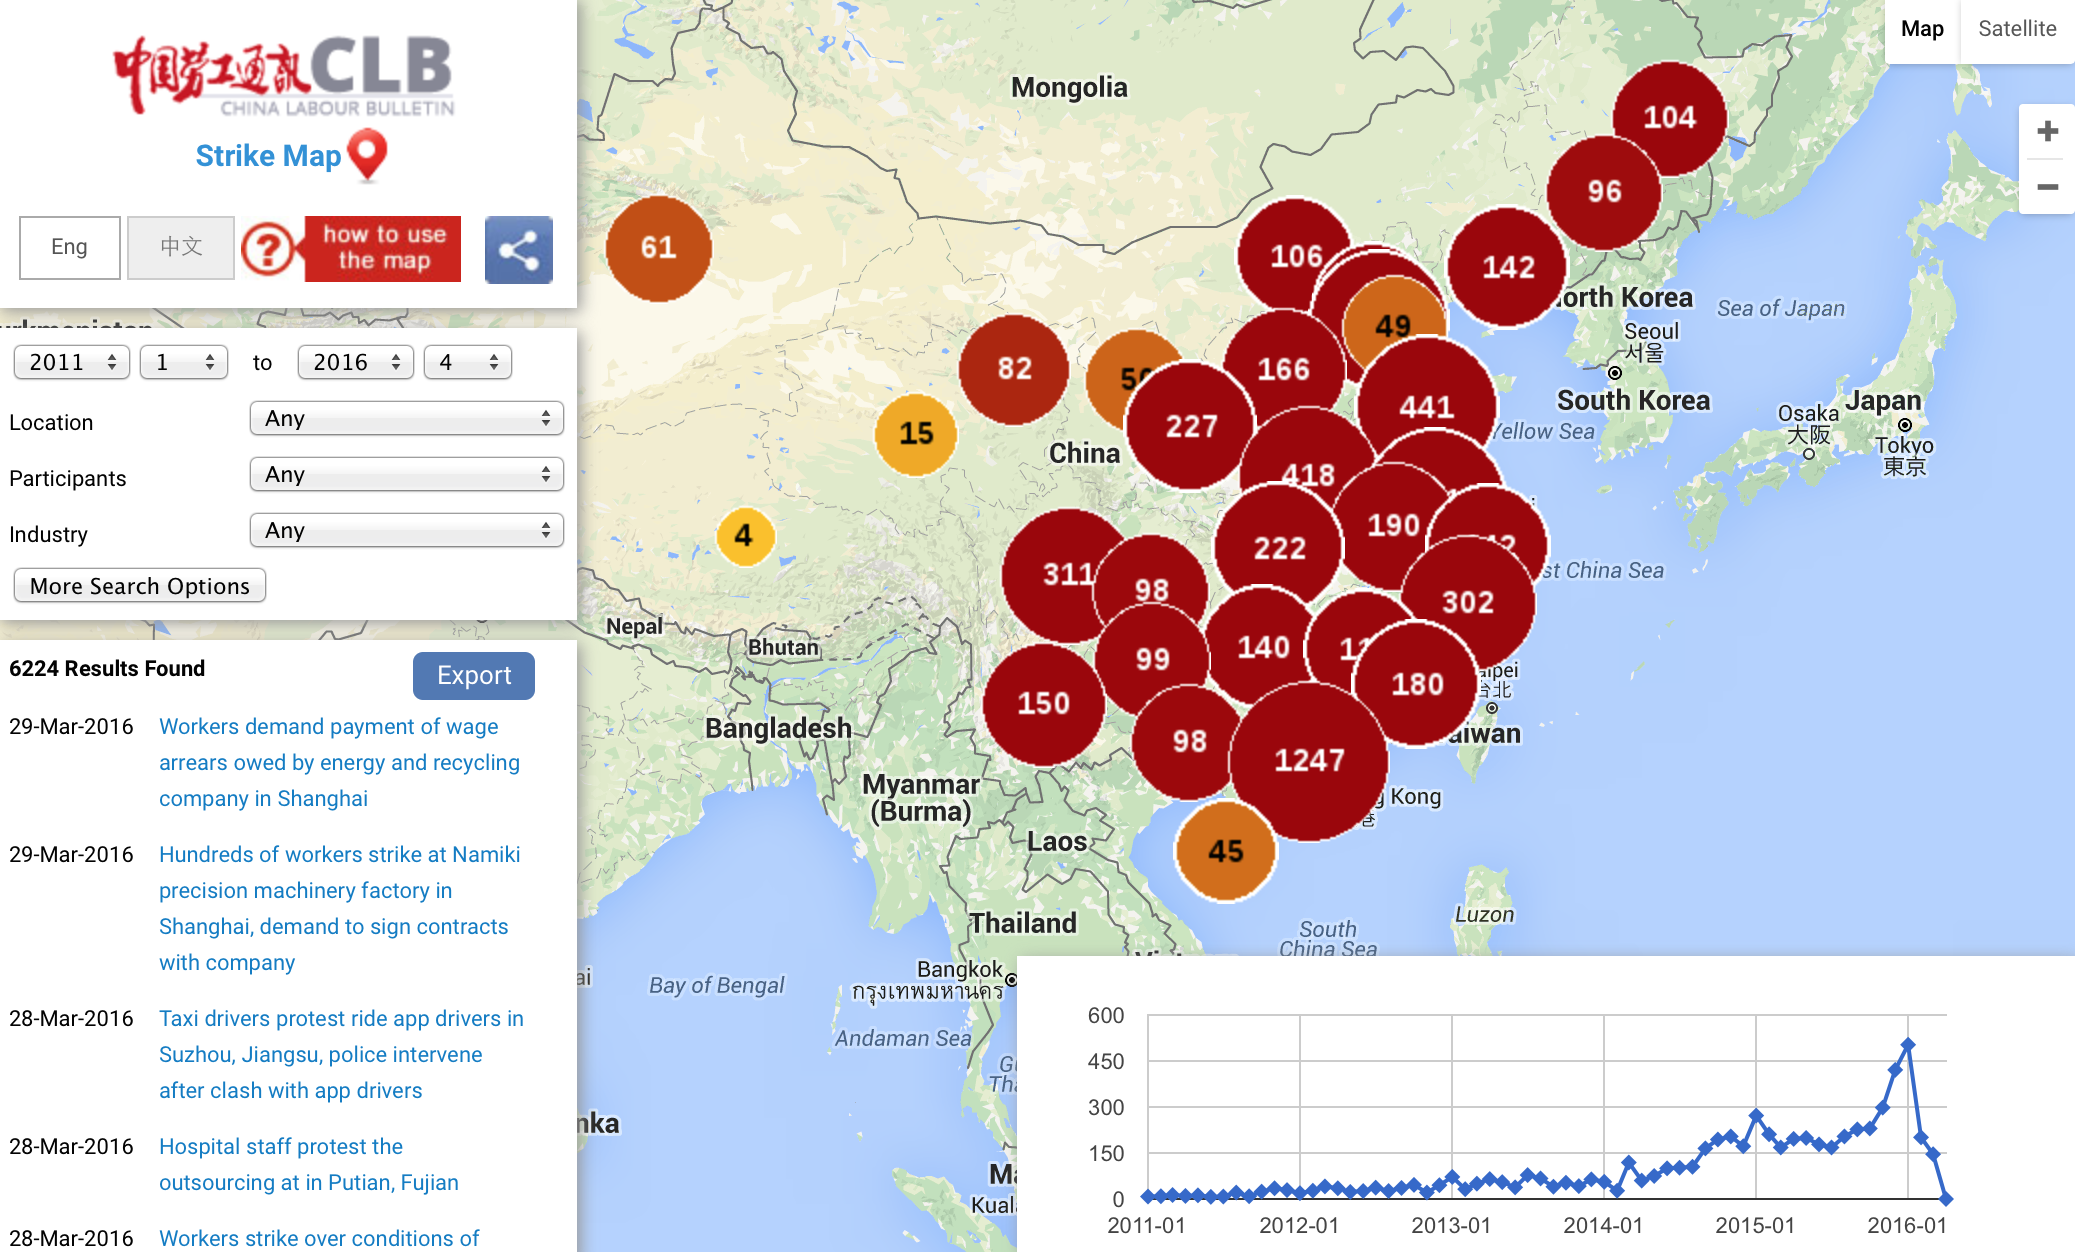
Yet this may be somewhat misleading: nearly half of the strikes indicated in the map above are thought to have had fewer than 100 people participate in them. It may be better to look just at the number of larger strikes that have occurred, as the following two maps do:
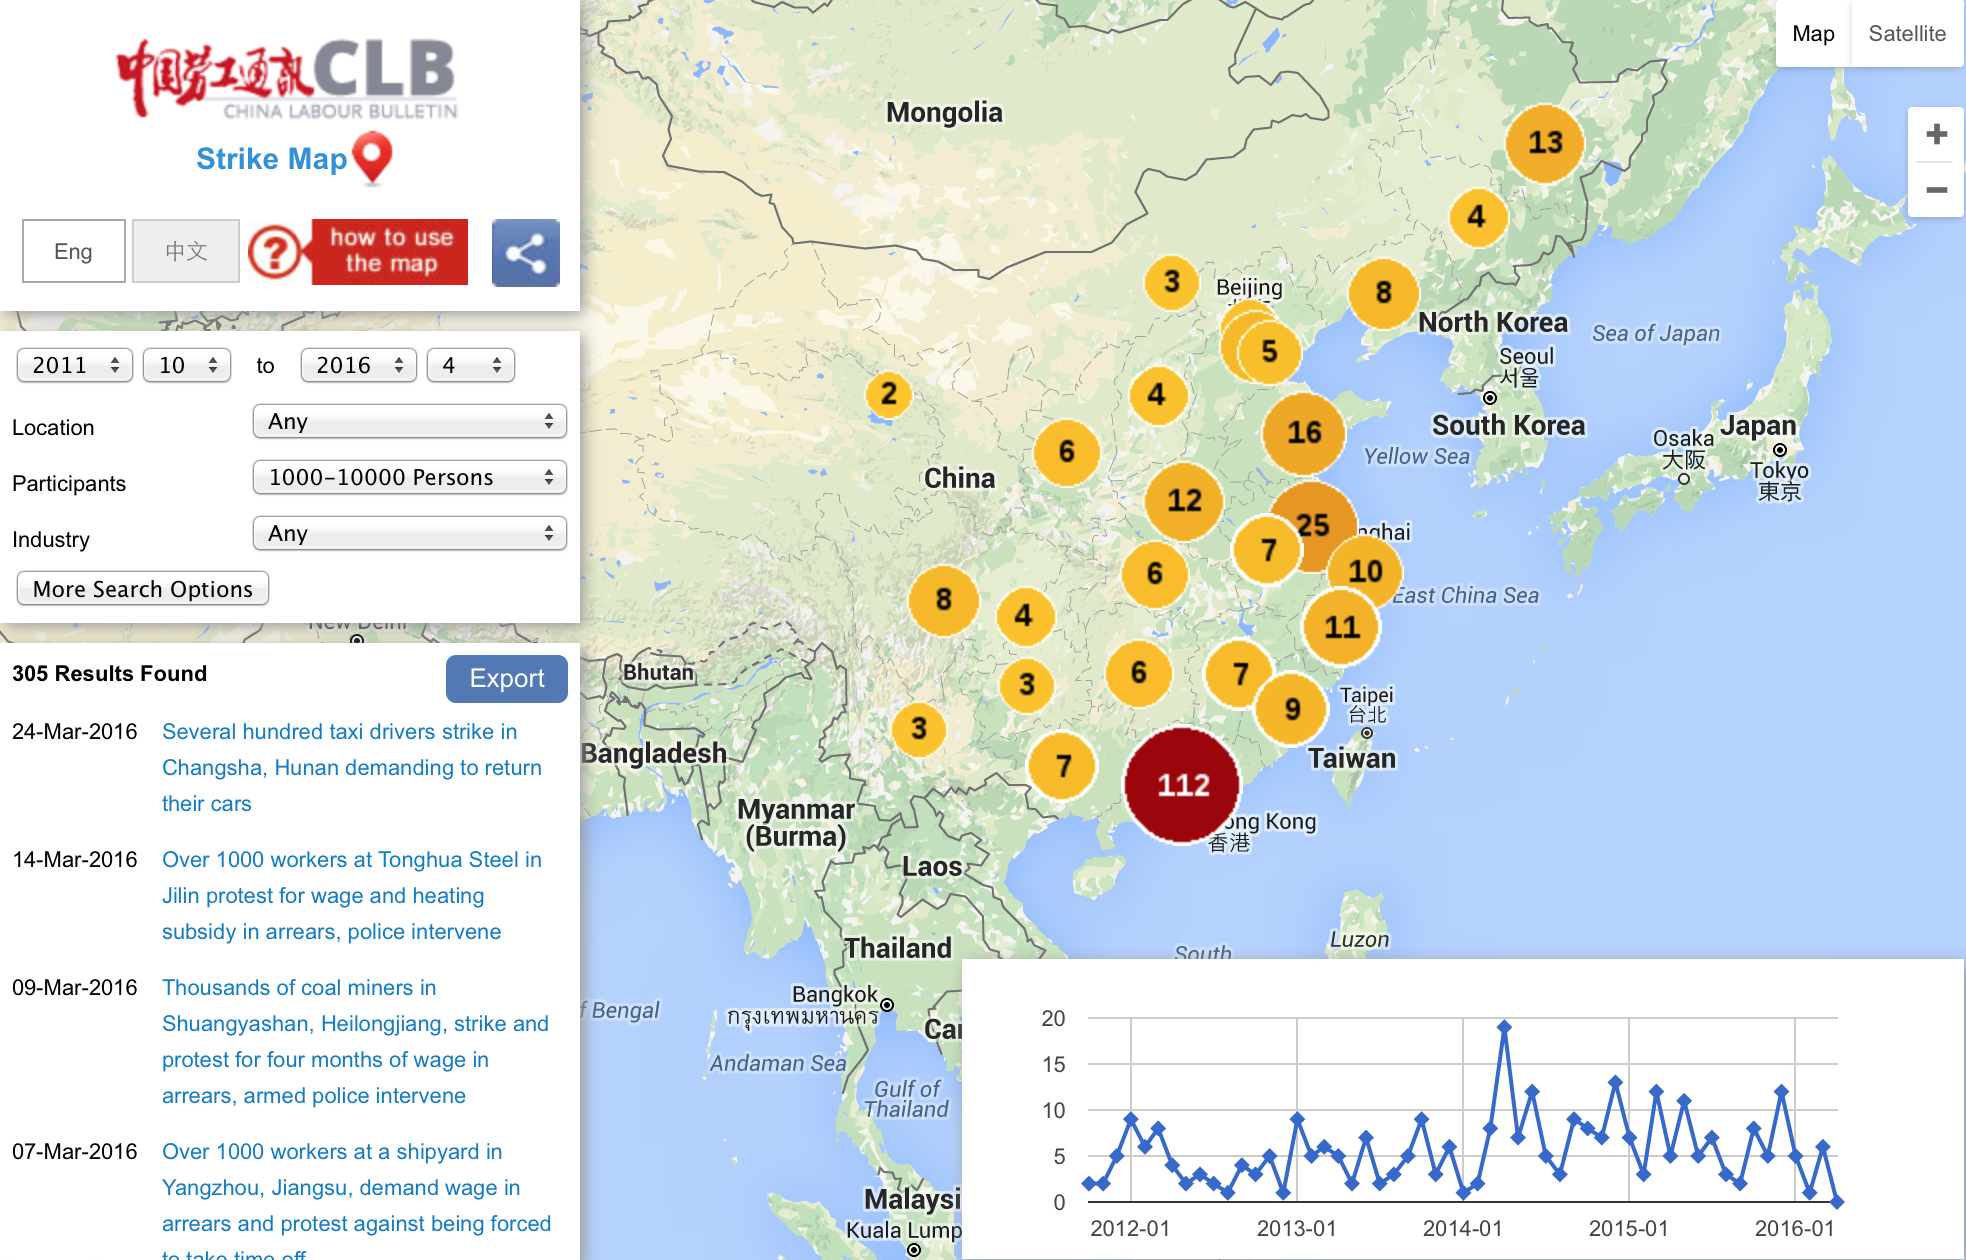

These maps above show that the larger strikes, with 1000-10,000 people and 10,000+ people, respectively, occurred most often in 2014, unlike the smaller but more numerous strikes that occurred most frequently in 2015 and so far in 2016. Since 2015 there have not been any strikes involving more than 10,000 people, in fact, according to the China Labour Bulletin.

Now let’s have a closer look at the differences between China’s many provinces. Below I have tried to graph out the number of strikes that have occurred in each province, first since 2011 and then since 2015:
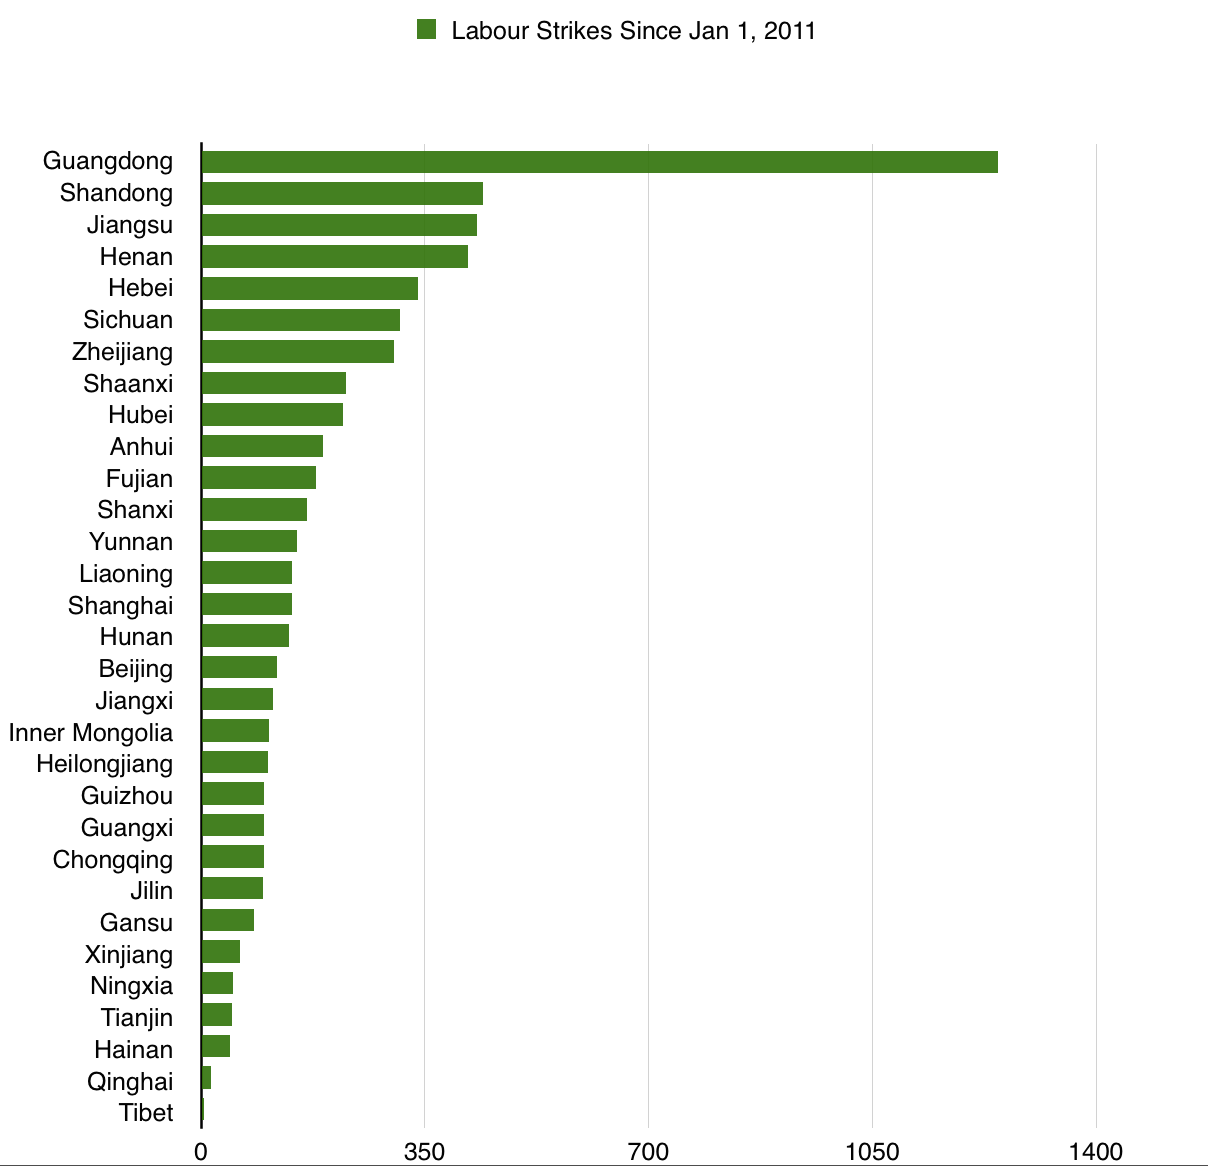
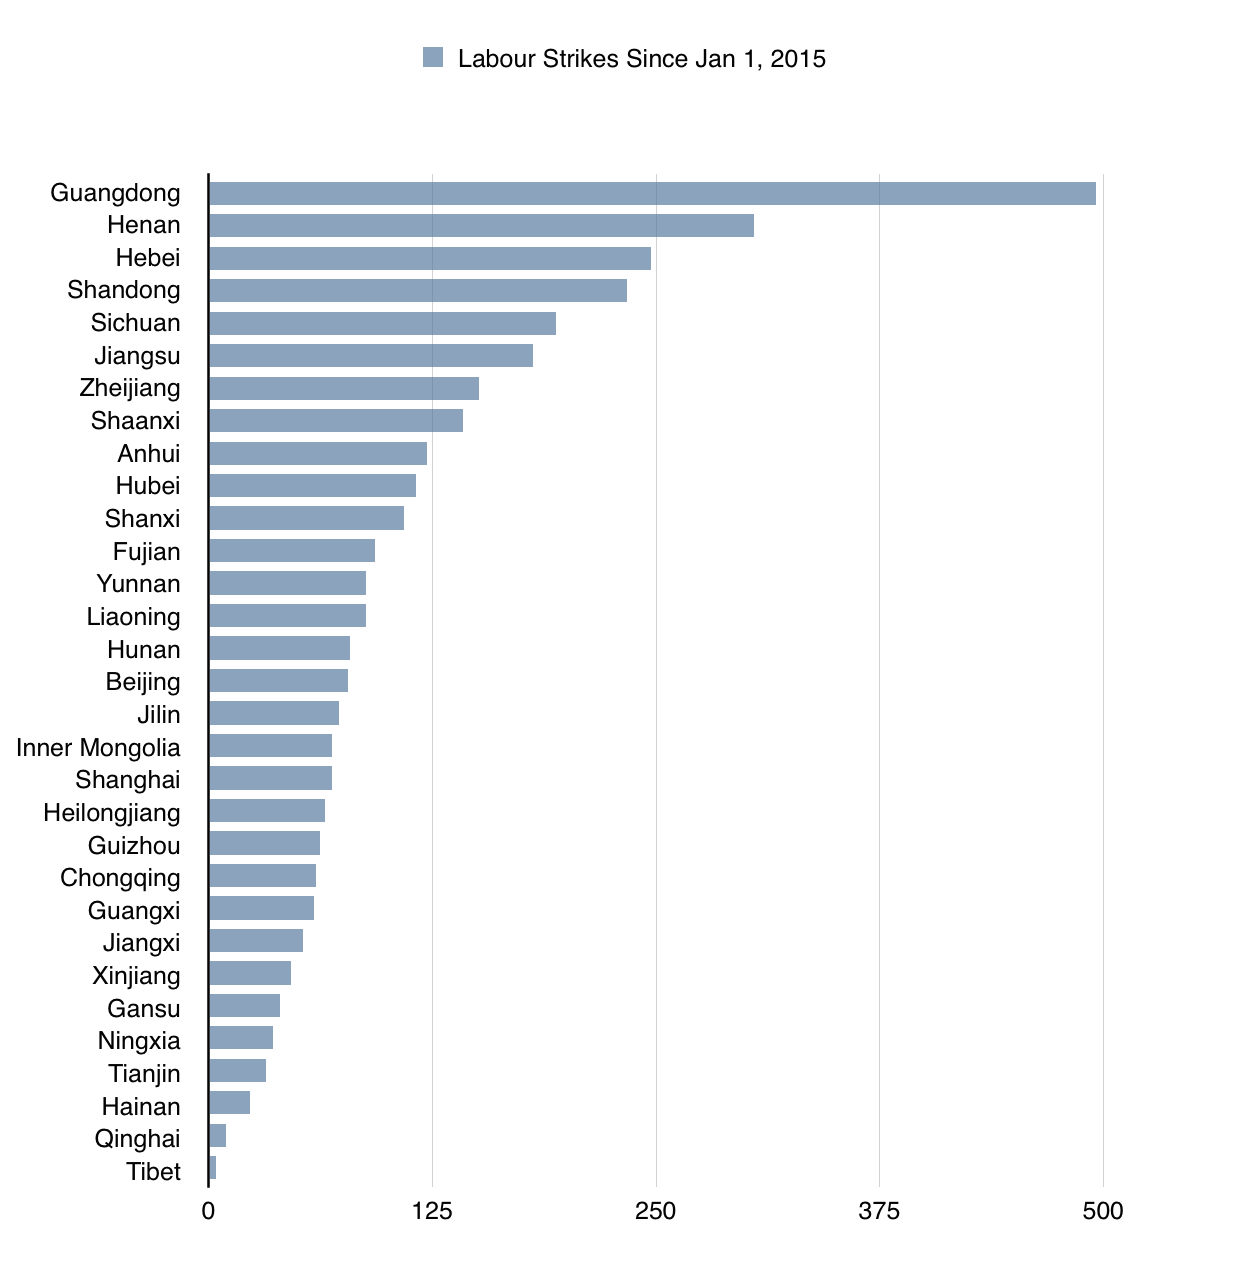
Guangdong, China’s most populous province, finished at the top of both graphs, while Tibet, Qinghai, Hainan, Tianjin, Ningxia, Gansu, and Xinjiang finished at the bottom of both graphs. All of the provinces of China are more or less in the same position in both graphs, in fact. And there are no major regional patterns that can be gleaned clearly from either list.
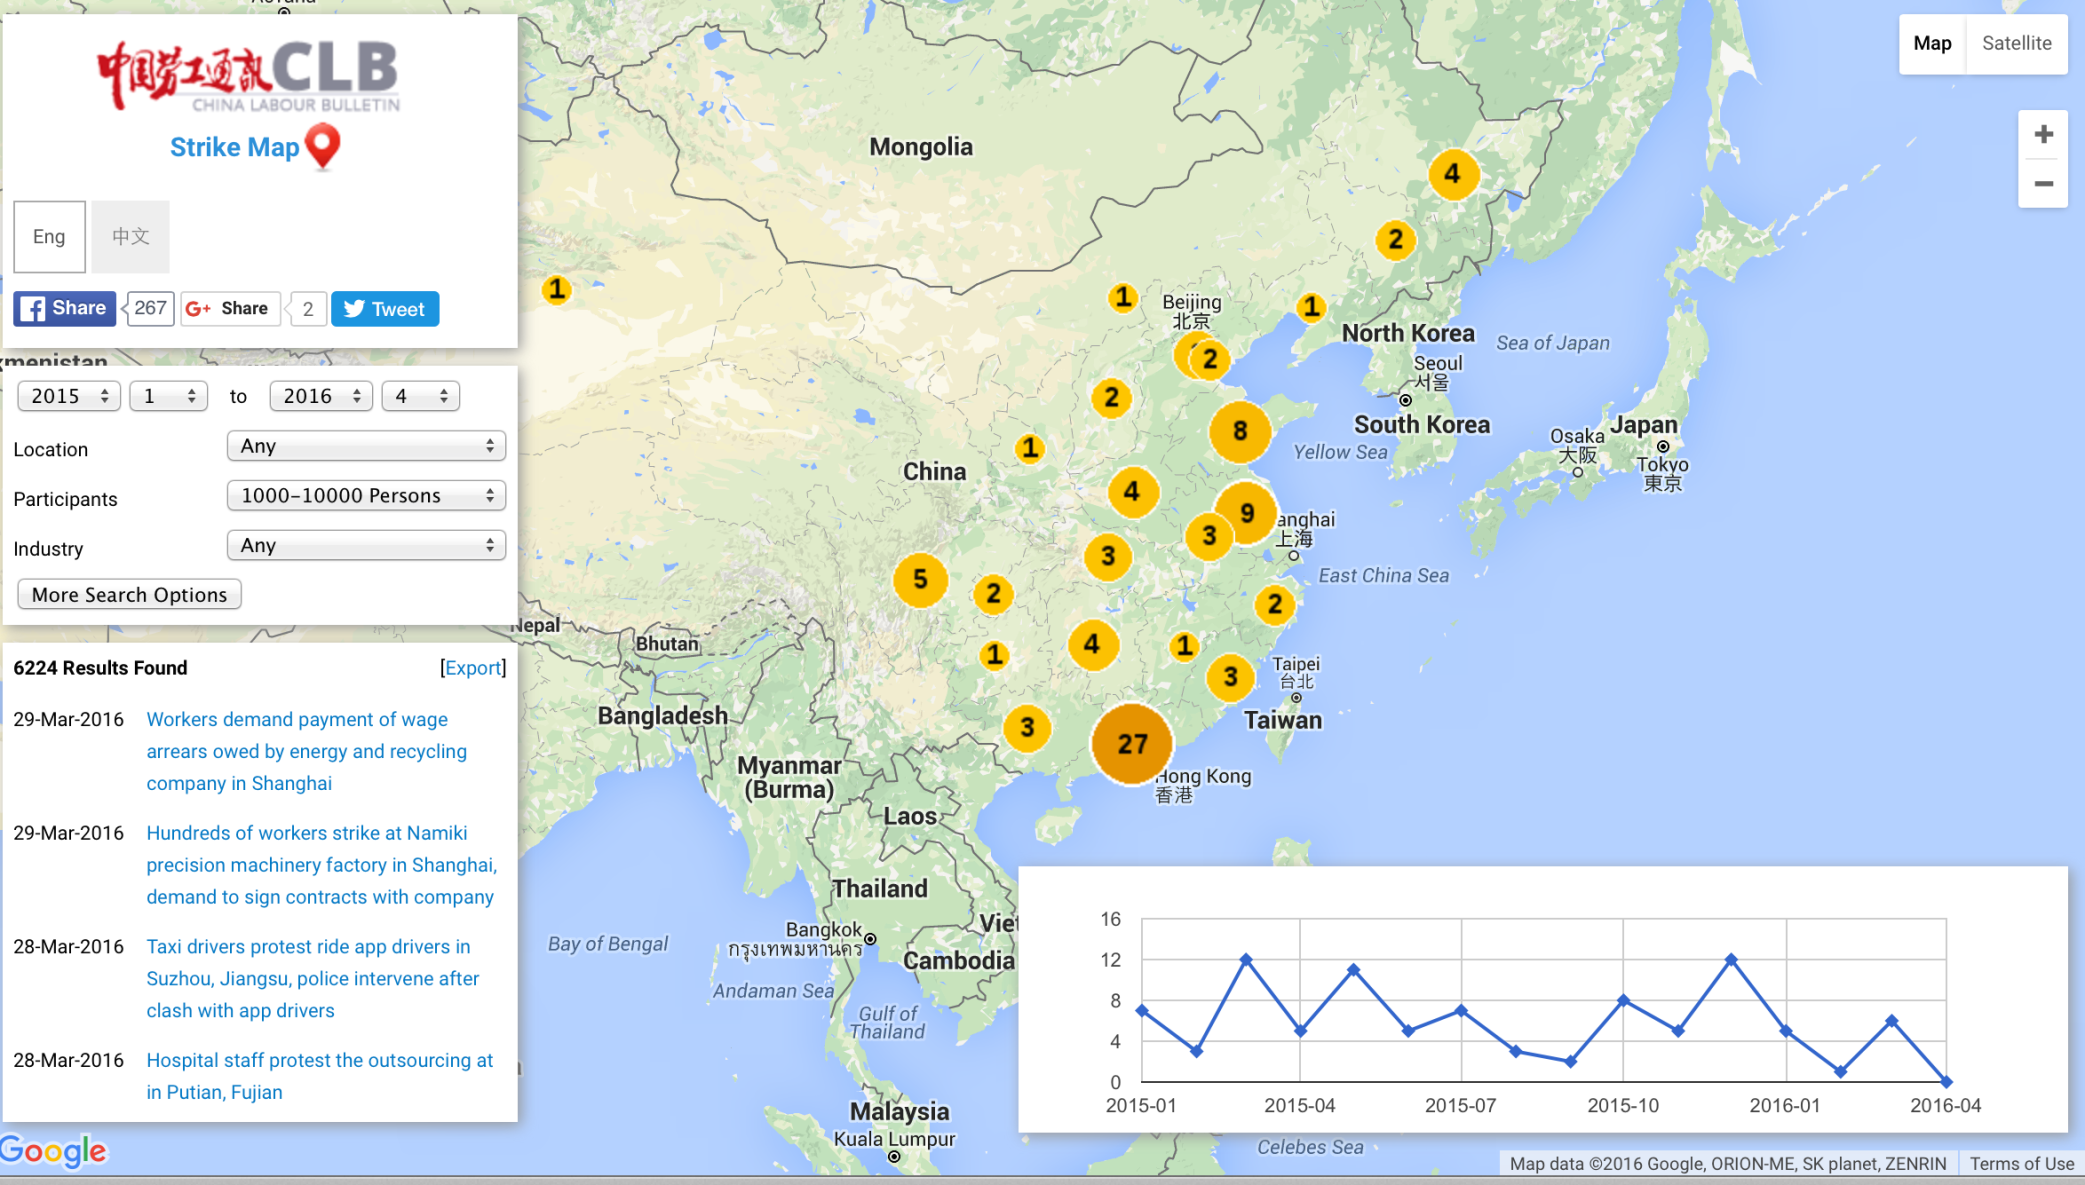
Labour strikes since January 1, 2015 involving at least one thousand people. Guangdong had 27, followed by Jiangsu with 9 and Shandong with 8.
What if we adjust the figures to take into account the population size and GDP size of each province? Then we get the following graphs:



Leave A Comment