It’s been a pretty nutty week for the equity market over the last four days as sectors which had been holding things up have sold off sharply, while sectors that had been left for dead, have been picking a little bit up of late. The charts below show the relative strength of the S&P 500 Technology and Financial sectors. As usual, rising lines indicate that the sector is outperforming the S&P 500 and vice versa. For much of 2018, these two sectors have been outperforming the rest of the market. With the two sectors accounting for just about 40% of the entire S&P 500, their strength was enough to hold the rest of the market up. This week, that all changed, though, as both sectors are down around 4%. For Technology, it hasn’t seen a downturn relative to the broader market that was this steep since late November, while the last decline of this magnitude for the Financial sector was in December.

So, which sectors have been picking up the slack? Well, of course, it’s the ones that everyone left for dead a few weeks ago. The charts below show the relative strength of the Energy and Utilities sectors, and in both cases, the sectors sold off sharply to start the year, but with the broader market weakness, both sectors have gotten a lift- relatively speaking. While the two have outperformed this week, they are still marginally lower.

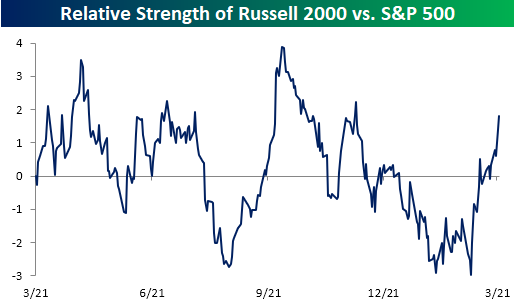
One area of the market that has seen a big boost with all the tariff talk is small caps. Despite Trump’s “America First” policies and rhetoric, the Russell 2000 has underperformed the S&P 500 over the course of President Trump’s time in office. Ever since the President brought up the issue of tariffs, though, the Russell has rallied and is now up 3% in March compared to a 2% decline in the S&P 500.


Leave A Comment