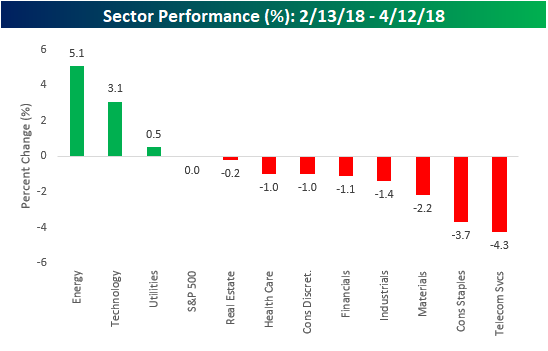
Despite massive volatility on a day to day basis, it may sound hard to believe, but the S&P 500 is currently trading right where it was nearly two months ago on February 13th. You read that right, in what has been the most volatile market environment in at least a couple of years, the S&P 500 has nothing to show for it – up or down!In terms of individual sectors, we’ve seen some rotation.
While Technology continues to be a market leader, it has been joined by former laggards like the Energy (+5.1%) and Utilities (0.5%) sectors to the upside. On the downside, Telecom Services, Consumer Staples, and Materials are all down over 2%, while Industrials, Financials, and Consumer Discretionary are down a percent.

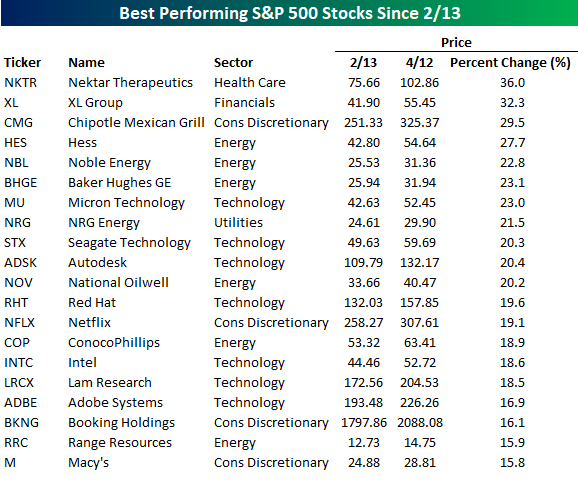
As far as individual stocks are concerned, 250 stocks are up and 250 stocks are down, so it couldn’t be more balanced. While a total of 43 stocks in the S&P 500 are up over 10% over the last 2 months, in the interest of space, the table below lists the twenty top performers. As you might expect given the sector’s leadership, a number of stocks from the Energy sector make up the list with Hess (HES), Noble Energy (NBL), Baker Hughes/GE (BHGE), and National Oilwell (NOV) all up over 20%. The top-performing stocks, however, have been Nektar (NKTR), XL Group (XL), and Chipotle (CMG), with each gaining close to or more than 30%. FAANG stocks had a good start to the year, but the only one that has been able to keep the momentum going is Netflix (NFLX), which is up nearly 20%.

While 43 stocks in the S&P 500 are up over 10% since 2/13, 37 stocks are down 10%+, and in the table below, we list the worst 20. As shown, just two of the worst performing stocks are down over 20% since February 13th, which is actually pretty surprising to us given the volatility. Those two stocks are L Brands (LB) and Incyte (INCY).Looking through the list of losers, though, there are a number of blue-chip stocks such as General Mills (GIS), QUALCOMM (QCOM), Comcast (CMCSA), Kraft Heinz (KHC), Biogen (BIIB), and Walmart (WMT).


Leave A Comment