As I’ve been noting again, again, again, again, and again the macro backdrop is marching toward changes. I’d originally thought those changes would come about within the Q4 window and while that may still be the case, it can easily extend into the first half of 2018 based on new information and data points that have come in.
One thing that has not changed is that stock sectors, commodities and the inflation-dependent risk ‘on’ trades and the gold sector, Treasury bonds and the risk ‘off’ trades are all keyed on the interest rate backdrop; and I am not talking about the Fed, with its measured Fed Funds increases. I am talking about long-term Treasury bond yields and yield relationships (i.e. the yield curve).
People seem to prefer linear subjects like chart patterns, momentum indicators, Elliott Waves, fundamental stock picks or the various aspects of ‘the economy’ or the political backdrop. They want distinct, easy answers and if they can’t ascertain them themselves, they seek them out from ‘experts’. But all of that crap (and more) exists within an ecosystem called the macro market. When you get the macro right you then bore down and get investment right. That’s the ‘top down’ approach and I adhere to it like a market nerd on steroids. And with the recent decline in long-term bond yields and the end of week bounce, the preferred plan is still playing out.
So let’s briefly update the bond market picture with respect to its implications for the stock market, commodities and gold.
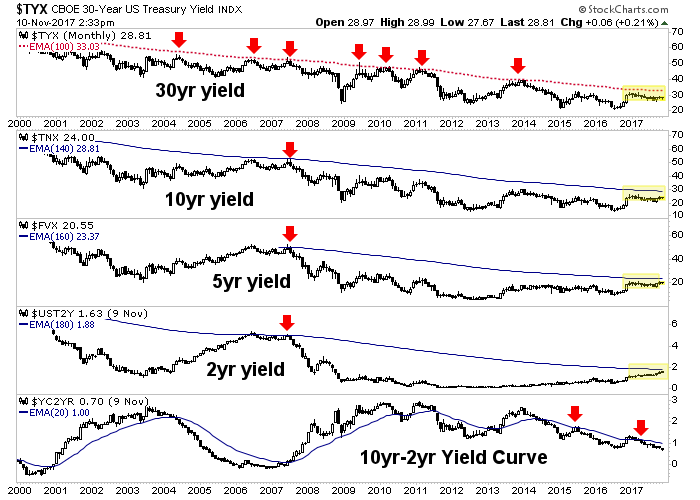
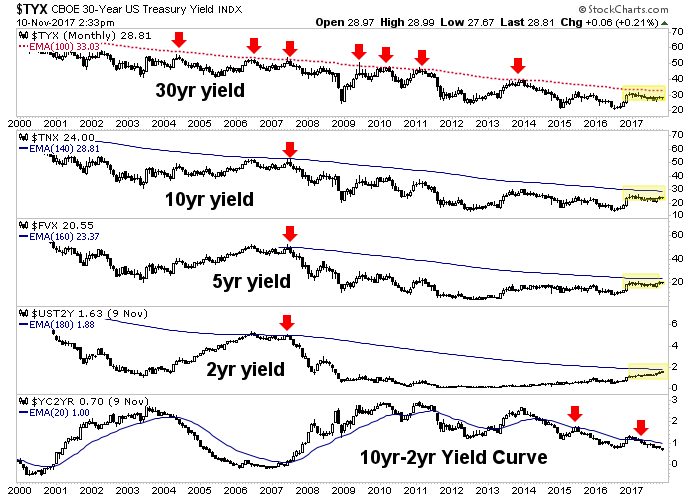
US Treasury yields are poised to reach the limiters, which are noted on this multi yield chart. We’ve been watching 3.3% on the 30 year and 2.9% on the 10 year (those are the levels of the ‘limiters’ AKA the monthly EMA 100 & EMA 140, respectively).


Leave A Comment