I know this is getting boring, but equities hit new highs yet again with Big Cap Value stocks leading the charge up +1.9% for the week. Thank you, IBM.
However, just when you may be thinking it’s just another strong week, the S&P 500 took record breaking to a level not seen since October 16, 1998.
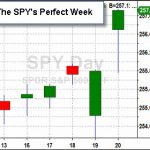
This week was a “perfect week” which is when all 5 days of the week set a closing high record. This has only occurred 18 times in history!
The image associated with this post is the chart of this “perfect” weeks price action. So even more surprising than the record is how inconspicuous this week’s price action pattern is given its remarkable accomplishment.
So, if you like, please rinse and repeat last week’s theme, October isn’t over yet, and the biggest meltdowns occur just before Halloween.
There are great volume patterns and price action in the DIA and the SPY, and the IWM also looks strong. The big exception is NASDAQ 100 which looks like it is rolling over or at least running out of steam. However, it is still up a blistering +25.5% YTD.
So, the likely hood of stocks falling from the sky is remote, unless of course something (like nuclear) does fall out of the sky. Unlikely and rare events like major wars can unhinge any market.
The flip side is when markets don’t run according to historical patterns, especially memorable ones, they often move strongly in the opposite direction much like we are seeing right now. One obvious reason is anyone anticipating a repeat of 1987 or 1929 are forced to cover their bets.
The other big theme beside the move to large cap and value is commodities. They have been in our crosshairs, and we have been probing.
Copper has been hot (a good and inflationary economic sign). Oil looks poised. And even some softs look like they are firming such as Cocoa.
Video length: 00:11:03


Leave A Comment