We now calculate that 62.51% of the stocks to which we can assign a valuation are overvalued and 23.3% of those stocks are overvalued by 20% or more. These numbers are similar to what we saw when we published our last valuation study in January. Since that time, we have been under an overvaluation watch or warning.
The so-called “Trump rally” or “post-election uncertainty rally” was a boon for the stock markets. However, reality has set in as investors have witnessed what appears to be a White House in disarray, a President unable to achieve promised legislative gains despite his party controlling both houses of Congress, and a general sense of amateurism despite the claims about being a great “deal maker.”
The failure of the TrumpCare legislative package in the House has created doubts about other Trump promises such as the tax cut package, the infrastructure plan, and other big items. That may cool the ardor for stocks in a time of rising interest rates as the Fed gets more ammo for change due to the continued good news on the labor front and the slight increases for the inflation rate. Both unemployment numbers and the inflation rate are now at levels where the Fed can claim that rate increases are warranted under their main mandates.
Of course, we still believe that the Fed should refrain from removing the so-called punch bowl just yet. Workers still need to benefit from the recovery and we feel there is still some weakness in the economy that needs to be wrung out. We also wonder about the overall health of the commercial real estate markets and believe some areas are getting dangerously overbuilt and that this could constitute a bubble as damaging as the housing market in the lead up to 2007-2008.
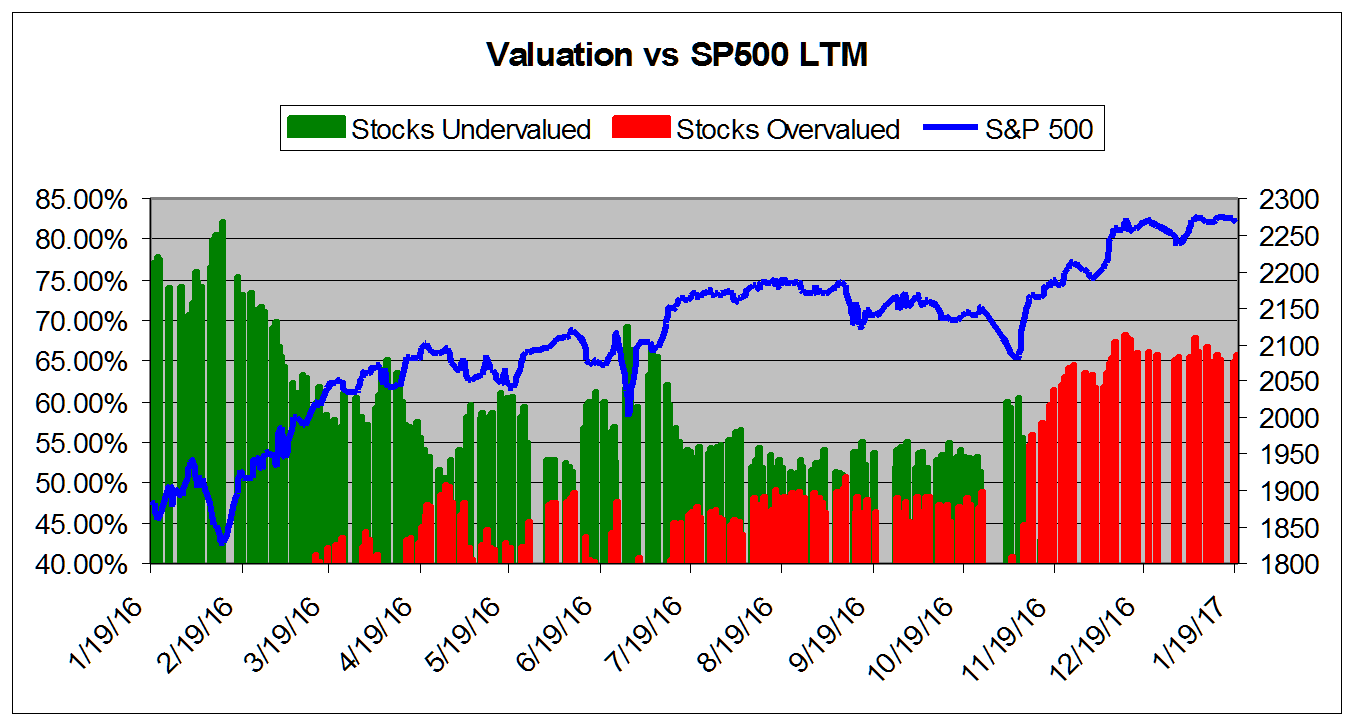
The chart below tracks the valuation metrics from April 2016. It shows levels in excess of 40%.

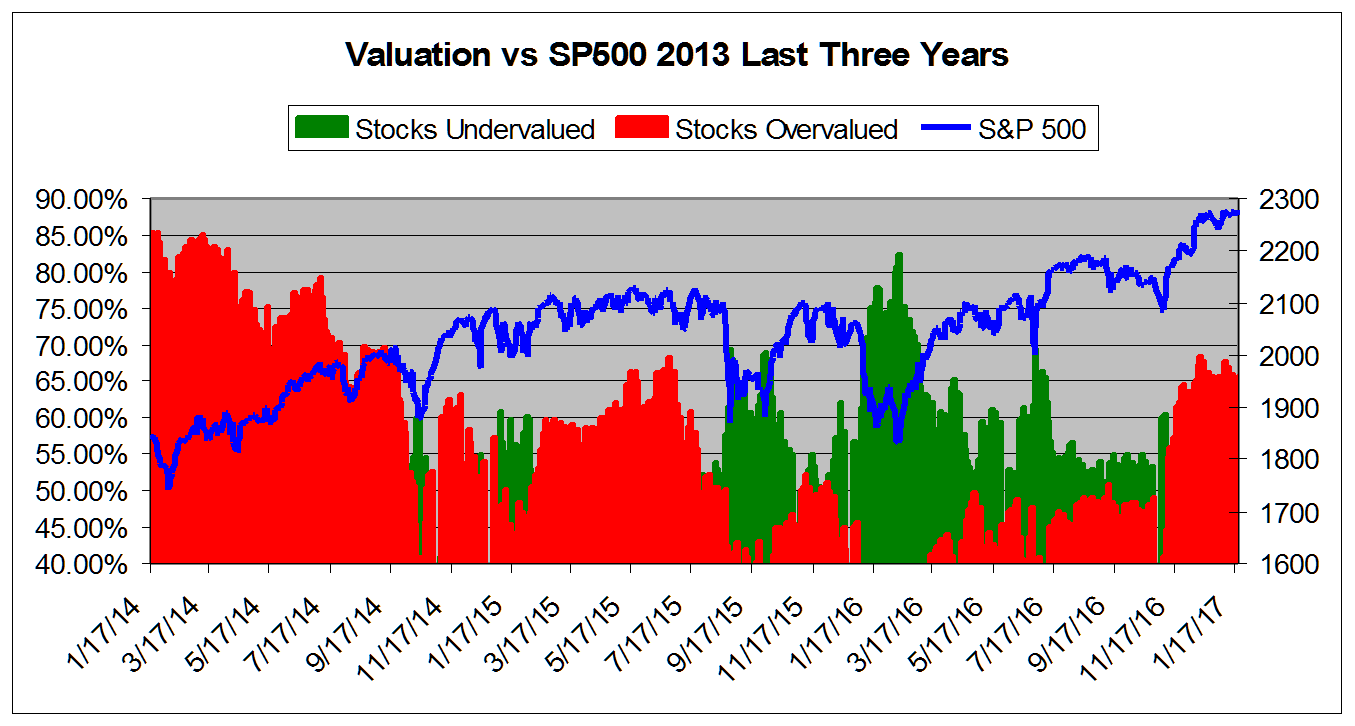
This chart shows overall universe overvaluation in excess of 40% vs the S&P 500 from April 2014

This chart shows overall universe under and over valuation in excess of 40% vs the S&P 500 from March 2007*


Leave A Comment