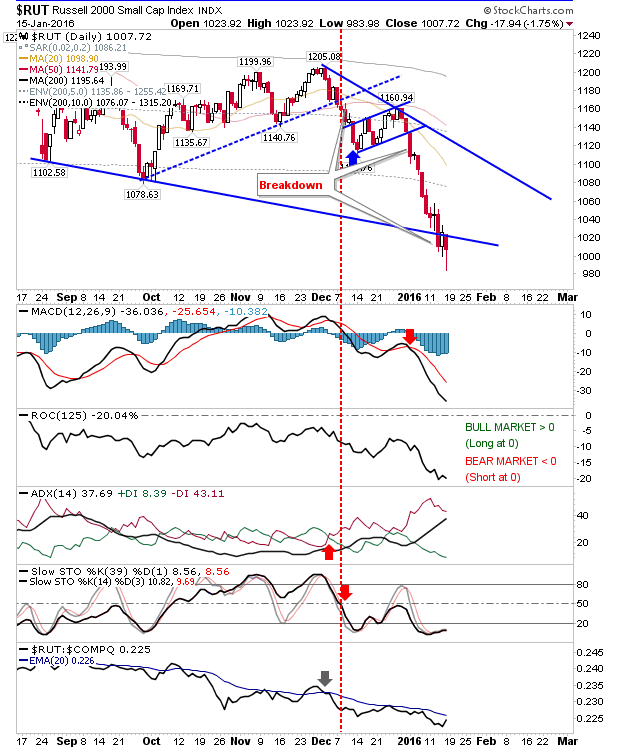
What had looked like a swing low on Thursday was quickly undone in early action Friday. While traders looking to trade a short term bounce were burned, those looking for long term opportunities were rewarded with further discount.
There wasn’t any change in the long term bottom watch. The S&P almost reached the 5% percentile of weak prices, last seen in November 2011. Likewise, the Nasdaq is close to the 10% percentile, while the Russell 2000 is already in one of the weakest periods it has experienced since 1987. This doesn’t mean prices can’t go lower, but if you have a hold time period of years there is value to be found in Small Caps stocks. The last time markets were this oversold was in 2011, and 2008 before that.
What would make it even better for long term buyers is if markets were to lose at least 25% from their last high. The next table marks the swing low watch. This is based on the difference between highest high and lowest low. In this world, there is still a long way to go, and if markets were to repeat the last declines then a 50% trim from highs would be the trigger.
As nobody knows what the market will do, the best course of action is to split the investment pot and take advantage of milestones as they are hit. We have the Moving Average trigger, next are the percentage falls from highs. And in terms of milestones, next is the Russell 2000 25% loss at 972.
Friday’s low in the Russell 2000 was only 10 points away from 972, and the long lower wick candlestick offers another potential sign of a bottom.

The retest of August/September lows doesn’t look like it will hold in the S&P, but a bounce back to 2,000 before a loss of 1,875 would be a scenario to watch in the weeks ahead.

The Nasdaq closed with a indecisive spinning top, which finished between August/September lows. For Monday, watch for a bullish morning star (a gap higher would complete). The flip side alternative is a retest of 4,292.


Leave A Comment