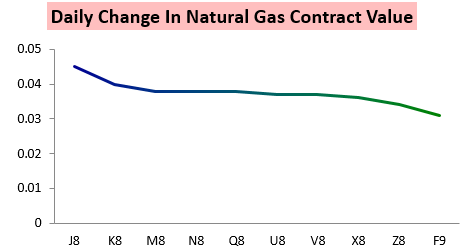
After a period of very slow trading, the prompt month natural gas contract finally had its largest daily change since February 20th, with prices rising 1.7% on the day.

Prices moved right into the $2.75 level that we had been warning clients would likely be tested for quite awhile. Back on February 27th, we said we saw limited upside to the $2.75 level but expected a tight balance to have us test it.

This level even got a mention all the way back on February 21st as the first resistance level prices should work their way up towards on March cold.

Our Morning Text Message Alert to clients warned that this may finally be the day that the $2.75 resistance level got tested too.

On the way up the entire strip participated, but for one of the first times of the last couple weeks the prompt month April contract actually led.

The result was a decent recovery in the J/K spread.

As those Notes from a couple weeks ago predicted, it was March cold that appeared at least partially responsible for this recovery in prices. As seen below, American GEFS guidance trended back colder in the 8-14 Daytime frame this afternoon, keeping heating demand close to average (courtesy of the Penn State E-Wall).

This cold is expected to keep natural gas stockpiles decently below the 5-year average through the next 4 weeks, as shown in the below chart to subscribers in our Seasonal Trader Report.

This Report, published in the middle of the week, outlines our 5-month GWDD forecast and looks out along the natural gas strip for opportunities to capitalize on potential mispricings of forward weather expectations. The Report accurately predicted cold risks later in December and provided traders a number of opportunities to capitalize on cold lingering through January as well. Today took a look through the shoulder season to when the first cooling demand could arrive, providing ideas on how traders may begin to position for that.


Leave A Comment