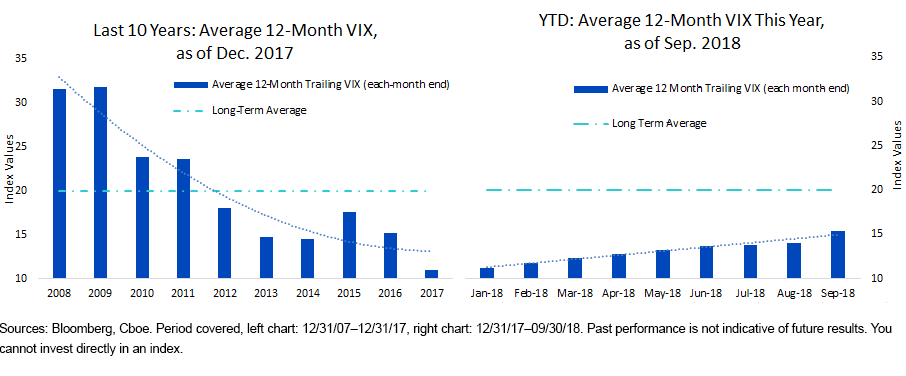
Despite last week’s pullback, 2018 has still been a positive year for many U.S. equity investors. If the S&P 500 Index closes positive this year, it will be its 10th consecutive positive year. A 10-year bull run has not happened since the 1950s. One significant way in which this bull market has manifested has been through lower volatility in equity markets.
However, as we head into the last quarter of the year, and looking ahead to 2019, many investors are asking whether there are telltale signs of a pickup in volatility. My analysis below tries to answer this very question and suggests some strategies to consider for an environment of rising volatility.
Nine-Year Decline vs. Nine-Month Pickup in Volatility
The U.S. Federal Reserve announced quantitative easing in February 2009. For the subsequent nine years, equities saw a massive run, along with a VIX that declined to an all-time low in 2017 (below, left). In contrast, the first nine months of 2018 have seen a consistent uptick in VIX numbers (below, right), though it remains below its long-term average. 2018 has seen some big jumps in volatility.

Will There Be a Further Pickup in Volatility?
I think the answer to this may lie with the VIX futures curve. Similar to the term-structure curves in relation to commodity futures, VIX can also have a futures curve, where different points on the curve suggest investors’ current expectations of implied volatilities at those times.
Under normal circumstances, as one moves further along the curve (into the future), the corresponding values should be higher. This is partly because a period of six months involves more uncertainty than one month. In other words, six months minus the one-month VIX futures spread is usually positive. Commodity traders refer to this upward sloping nature of a futures curve as being in “contango.” It implies a roll cost every month—which is why investor’s structurally long volatility-hedging products can face a strategic challenge.


Leave A Comment