Yes, an inverted yield curve has been a good predictor of recessions. And yes, the yield curve has been flattening for the last year. But no one can predict when the yield curve will actually invert. This is another fruitless endeavor that will only harm the investor.
Currently, the yield curve is only about 20 basis points away from an inversion. But, this information alone tells us nothing about the future. The above chart shows the yield curve (2’s and 10’s) during the major stock market rally of the mid-1990’s. From 1995-2000, the yield curve spent most of the time between 20 and 60 basis points. Let’s see how the stock market performed during this time:
1995: +37.20%
1996: +22.68%
1997: +33.10%
1998: +28.34%
1999: +20.89%
As you can see, stocks can perform well in a flattening yield curve environment. And an inversion can take years. Aside from this, an investor need not attempt a prediction of an inversion for two reasons.
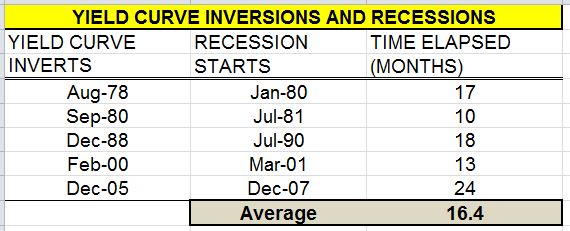
1) Average length of time between a yield curve inversion and a recession is 16.4 months

Going back to 1978, the data shows ample time between the yield curve inversion signal and a realized recession including a full two years before the 2005 inversion, until the 2007 recession.
2) Stocks have averaged a 15.72% return in between a yield curve inversion and a recession.

In the same time frame, stocks have posted double digit returns between the inversion and recession in all but one of these time periods.

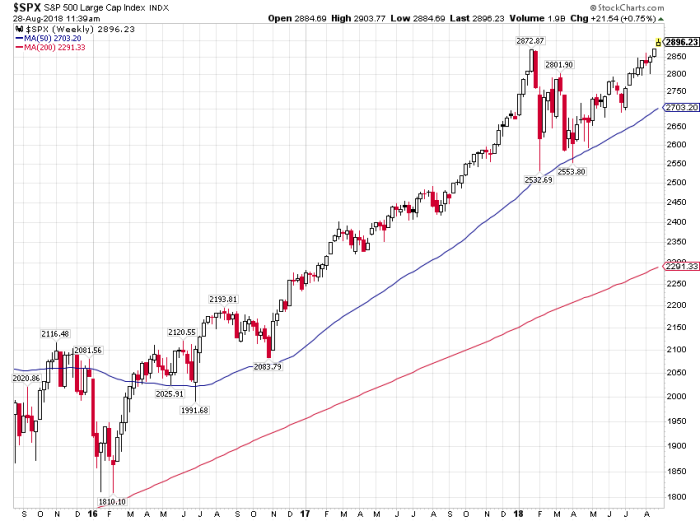
The stock market is clearly in a bull market. The S&P 500, Nasdaq, & Russell 2000, have all made new all-time highs, and the Dow is not far behind. Investors should enjoy it, and spend less time trying to predict when its all going to end.


Leave A Comment