…We sometimes get criticism for not being more bullish on the metals,always wanting to see confirmation. Gold and silver appear to be at a turning point. The probability of last November/December lows being a bottom keeps increasing. While decreasing in its probability, one more downside washout of those lows still exists, however small the potential may seem.
Guest post by Michael Noonan (edgetraderplus.com) consisting of 502 words and 6 charts excerpted from the 1736 word edgetraderplus.com.
There has been clear change in developing market activity that is favorable for gold and silver, both having the best and strongest recent rally since the 2011 highs. The rallies were also accompanied by the strongest volume increases over the past few years, another positive sign.
For us, charts are the proverbial picture being worth 1,000 words for they convey what the actual market is doing in real-time, irrespective of the (un)related news on any given day.
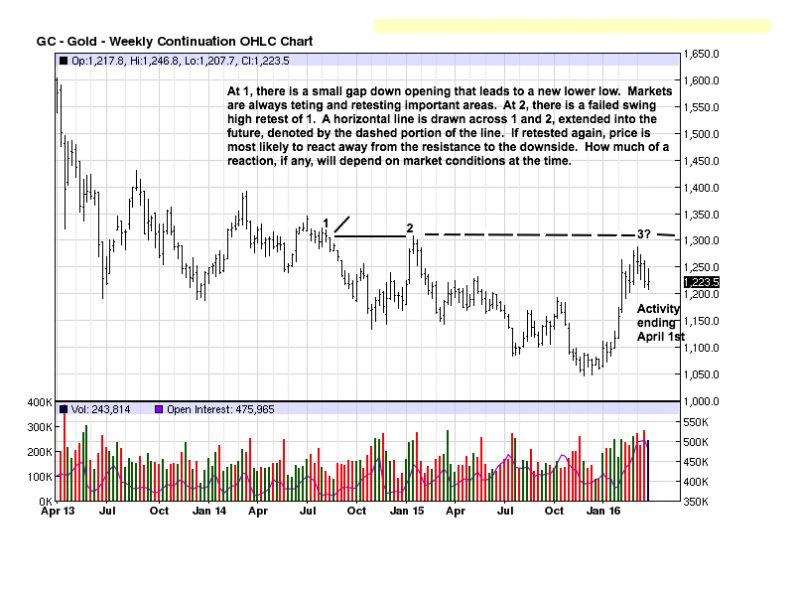
For the weekly gold and silver charts, we will first show activity ending at the beginning of April. The purpose is to demonstrate how past activity can, and does relate to the future, which them becomes present tense.
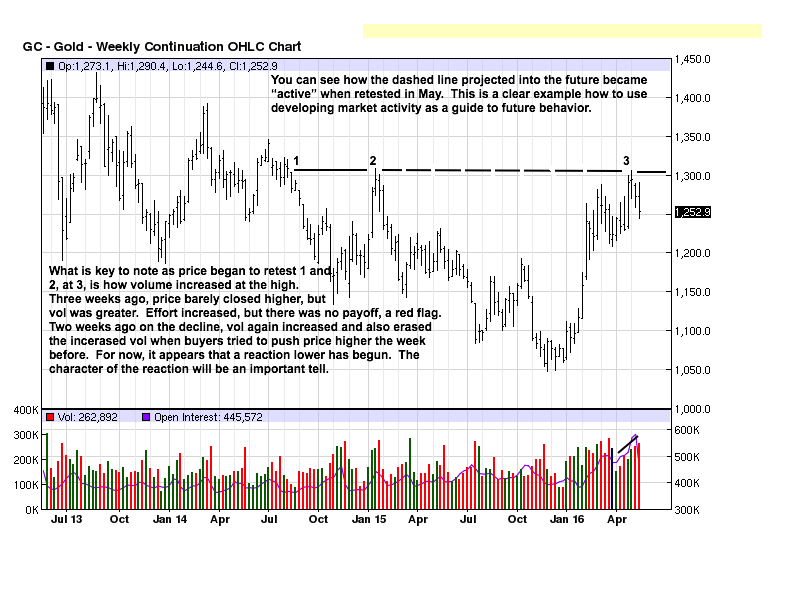
Points 1 and 2 are the reasons for expecting some kind of future reaction at 3, whenever price reaches that level. It is a way to be prepared at higher probability reaction areas.

The potential area at 3 became reality the first week in May. The question then became, is price absorbing to go higher, or will it fail, at least temporarily, and react lower. It has reacted. The information from increasing volume at the 1300 level was not totally clear until the last 2 trading weeks, and really not until the very last week. See daily.

The small range bar at the high was a red flag potential because price stalled. The picture was not clear because there was no real reaction lower, and price could still be absorbing sellers in preparation to rally above 1300. The last five TDs indicated a correction would develop. Now, it is a question of how much? Last Thursday’s high volume, coupled with the small range and just above mid-bar close says buyers were more dominant than sellers,


Leave A Comment