Now that the Fed interest rate decision storm is behind us, let’s take a look at this pair to see if there are any new signals for traders.
1- Technical Points
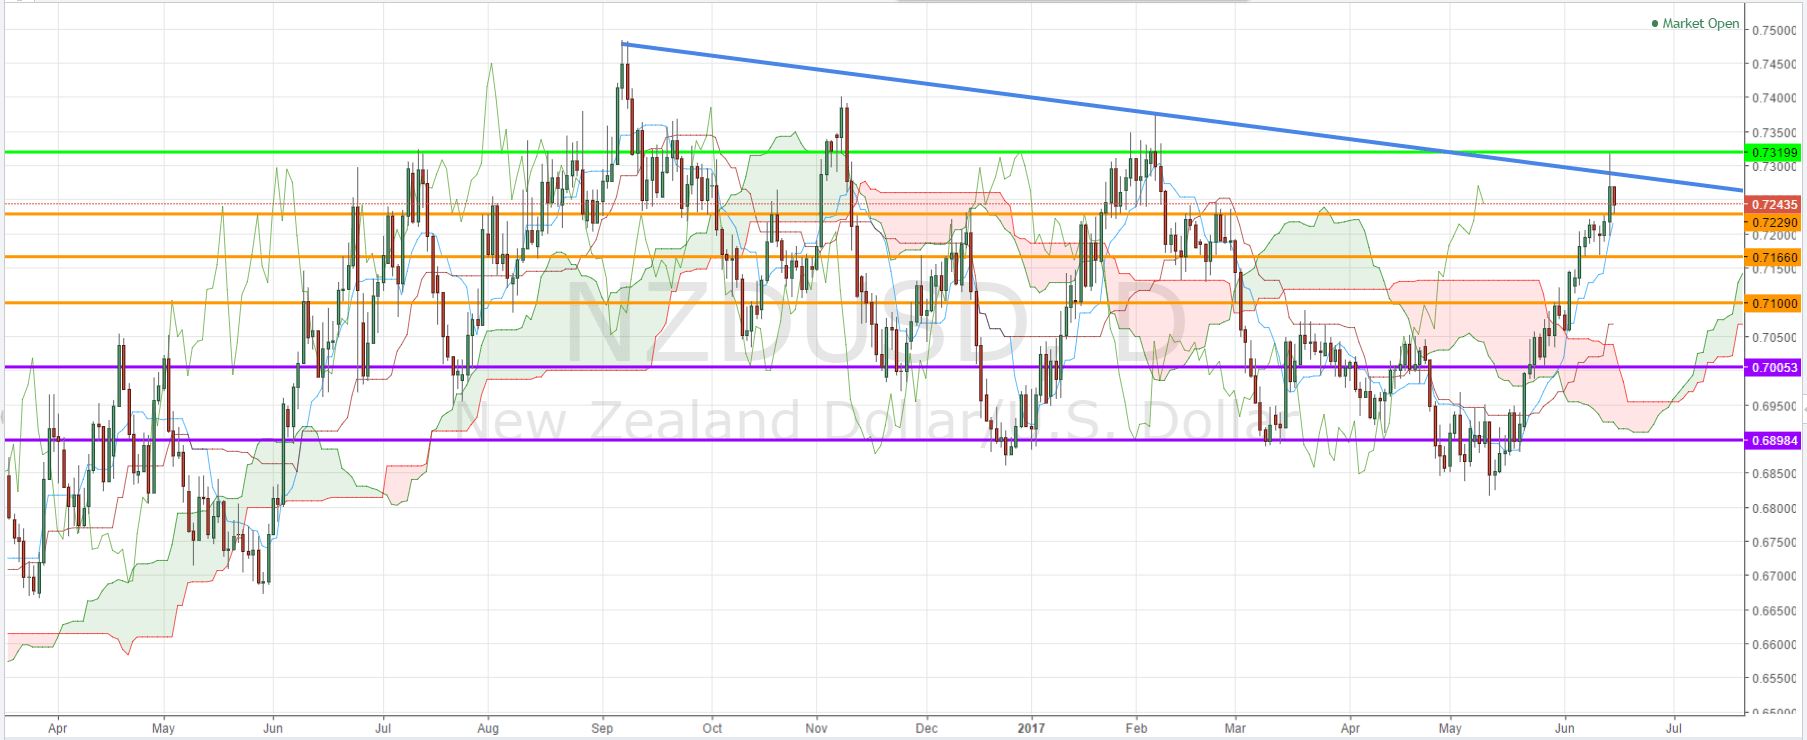
Daily Time Frame: The NZD/USD pair hit a key resistance of 0.7319 on Wednesday on the volatility cause by Fed rate decision. However the sentiment quickly changed upon Thursday Sydney market open, as New Zealand GDP came out. While the pair remains above the Ichimoku cloud, the cloud-based bullish indication may already have expired due to the strength of 0.7319 resistance, at which the pair formed the 4th high of a series of lower highs developing since September 2016.

NZD/USD Profit Targets Reached – Daily Chart Technical Analysis for What’s Next.
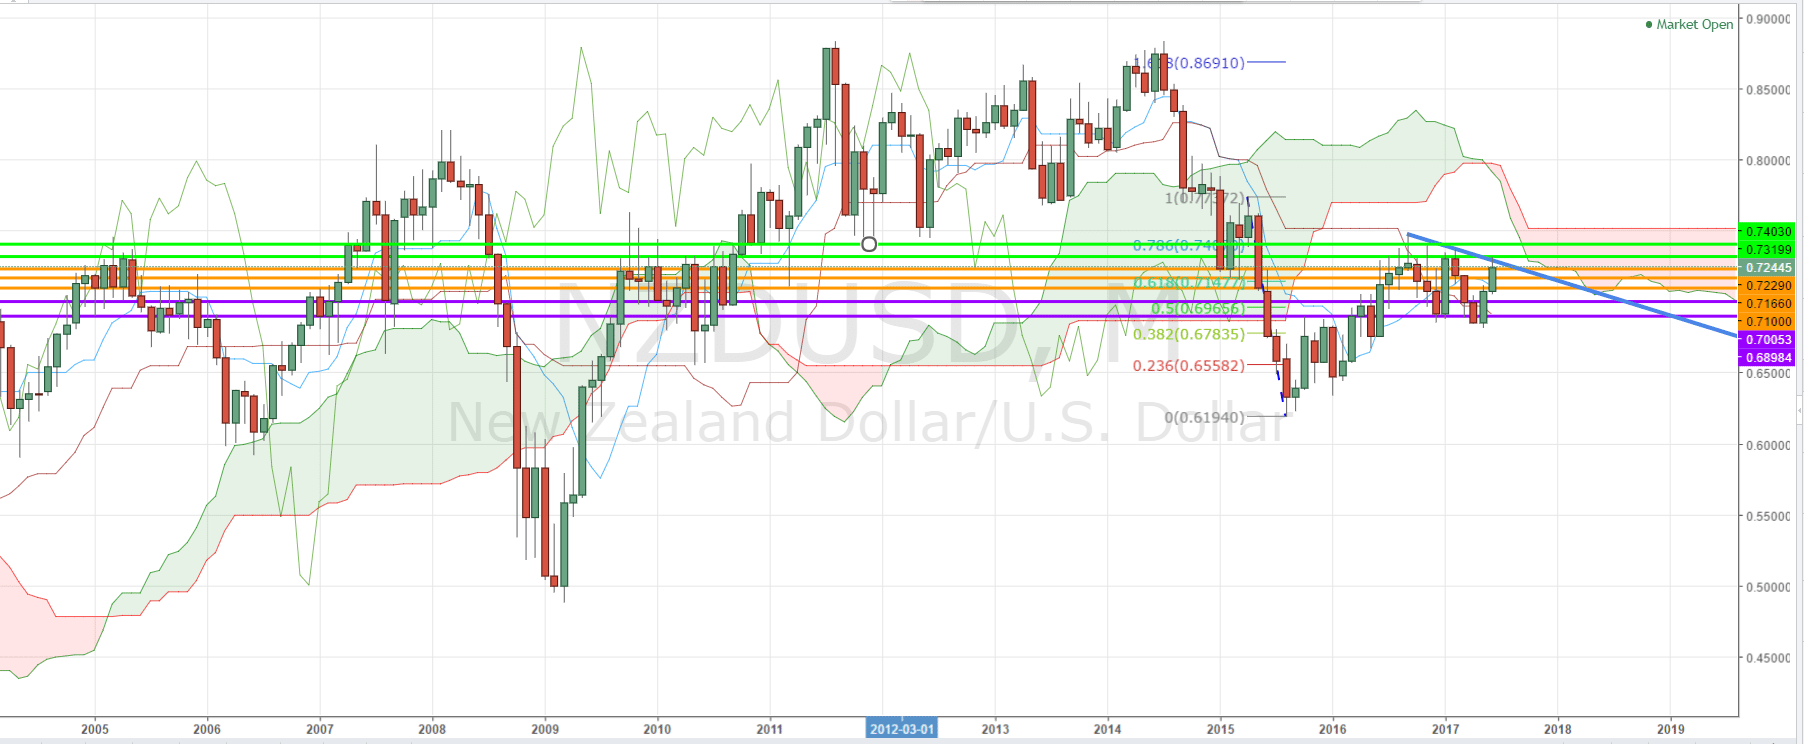
Monthly Time Frame: Zooming out to the monthly time frame, we notice that the pair has actually been consolidating below the monthly Ichimoku cloud, after attempting to correct the massive downfalls which continued during the 2014 – 2015 period. The breakout of this long-term consolidation could finally indicate whether the prior correction was in fact a bullish reversal, or the pair is going continue its long-term downtrend to reach the lows of 2009 in the coming years.

NZD/USD Profit Targets Reached – Monthly Chart Technical Analysis for What’s Next.
2- Fundamental Points
New Zealand Side: New Zealand’s gross domestic product (GDP) climbed 0.5% on quarter in the first three months of 2017, Statistics New Zealand said on Thursday. The GDP went up from a pace of 0.4% in the previous quarter but falling short of the expected 0.7%.With that their economy grew less than anticipated in the first three months of 2017 despite robust growth in agriculture. Construction activity fell for the first time since June 2015 and dairy exports shrank.
Much lower building activity combined with mixed results for the service sector took the shine off higher dairy production and saw a second quarter of moderate overall GDP growth. This can help explain the NZD drops during Thursday’s Asian session.


Leave A Comment