NZD/USD Weekly

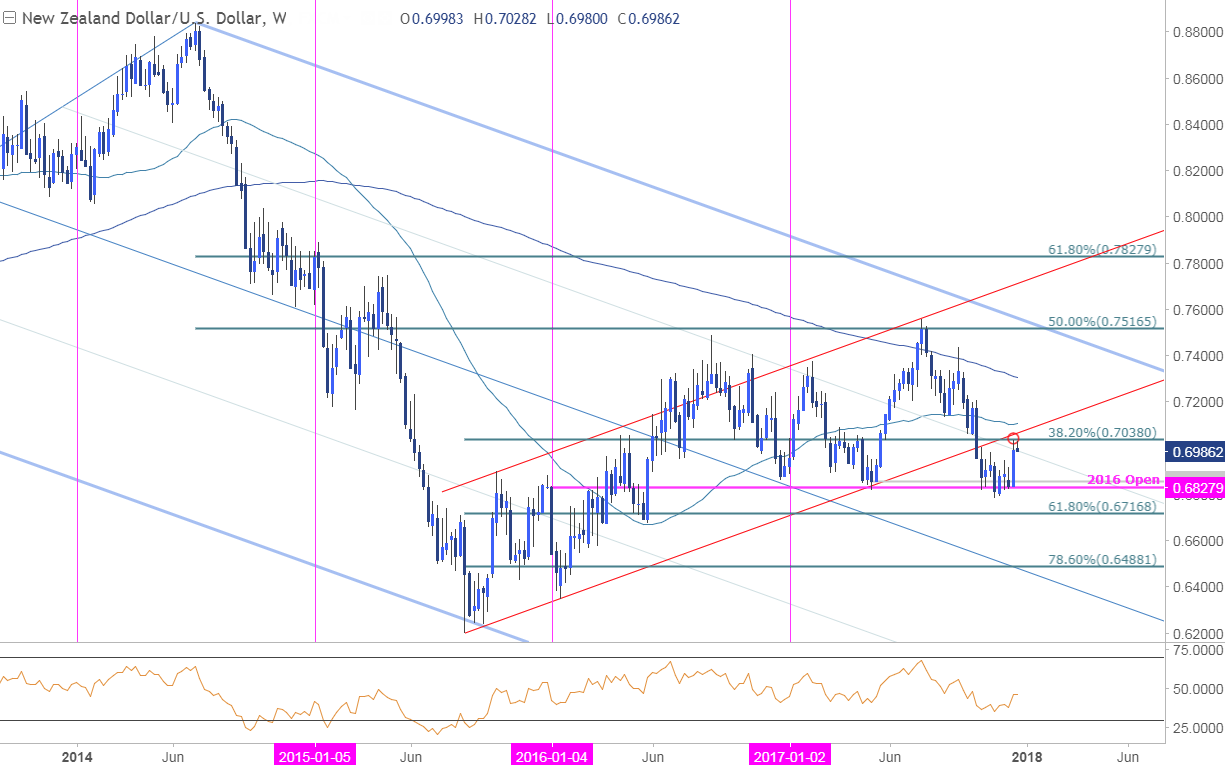
Technical Outlook: Kiwi broke above the December opening range last week, shifting the medium-term outlook higher in the pair. The rally turned just ahead of a key resistance confluence at 7038– note that the 52-week moving average stands just higher at ~7100. The immediate advance is at risk heading into this threshold and the focus is on a reaction off this mark.
NZD/USD Daily Chart

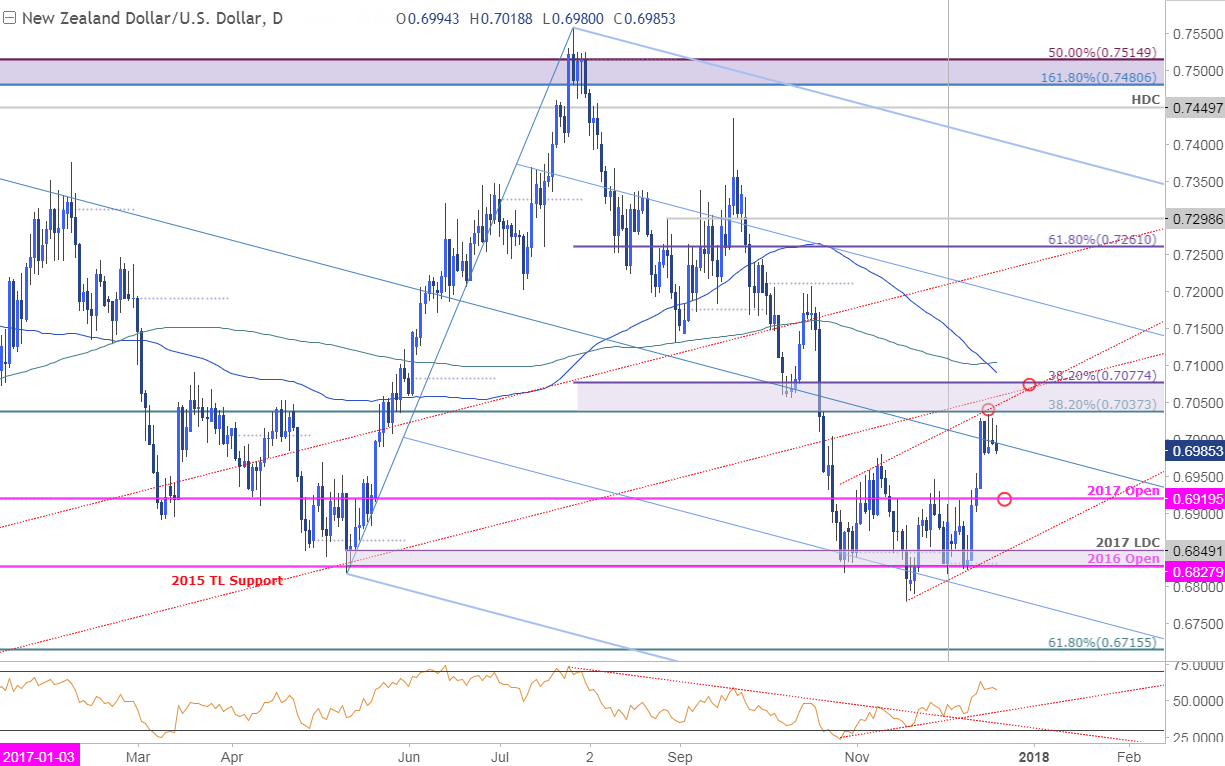
The daily chart further highlights 7037/77 as a key resistance zone with both long & short-term slopes converging on a pair of Fibonacci retracements. A pullback off this level is likely but the broader focus remains weighted to the topside while above the yearly open at 6919.
NZD/USD 240min Chart

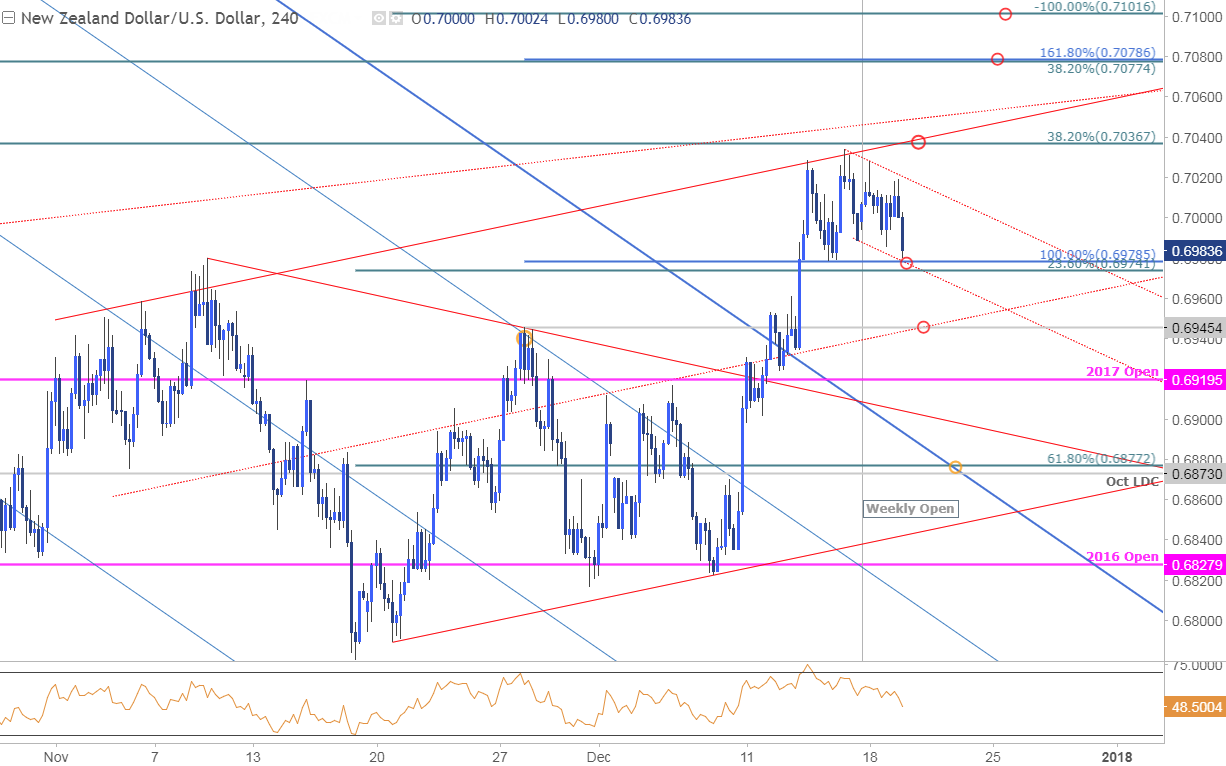
Notes: A closer look at price action sees the pair trading within an ascending channel formation extending off the yearly lows with slope resistance capping last week’s rally. Look for initial support at 6975/79 backed by 6945– a break below this region would risk a larger setback towards the yearly open at 6920 & confluence support at 6873/77– (both levels of interest for near-term exhaustion / long-entries if reached).
A breach above this near-term descending channel off the highs targets the upper parallels backed by 7077/78. Note that a measured move of the consolidation break noted last week targets a stretch towards 7100 (also the 52-week moving average). Bottom line: The immediate threat is lower but we’ll be looking for the decline to offer favorable long-entries, ultimately targeting a breach towards 7100.


Leave A Comment