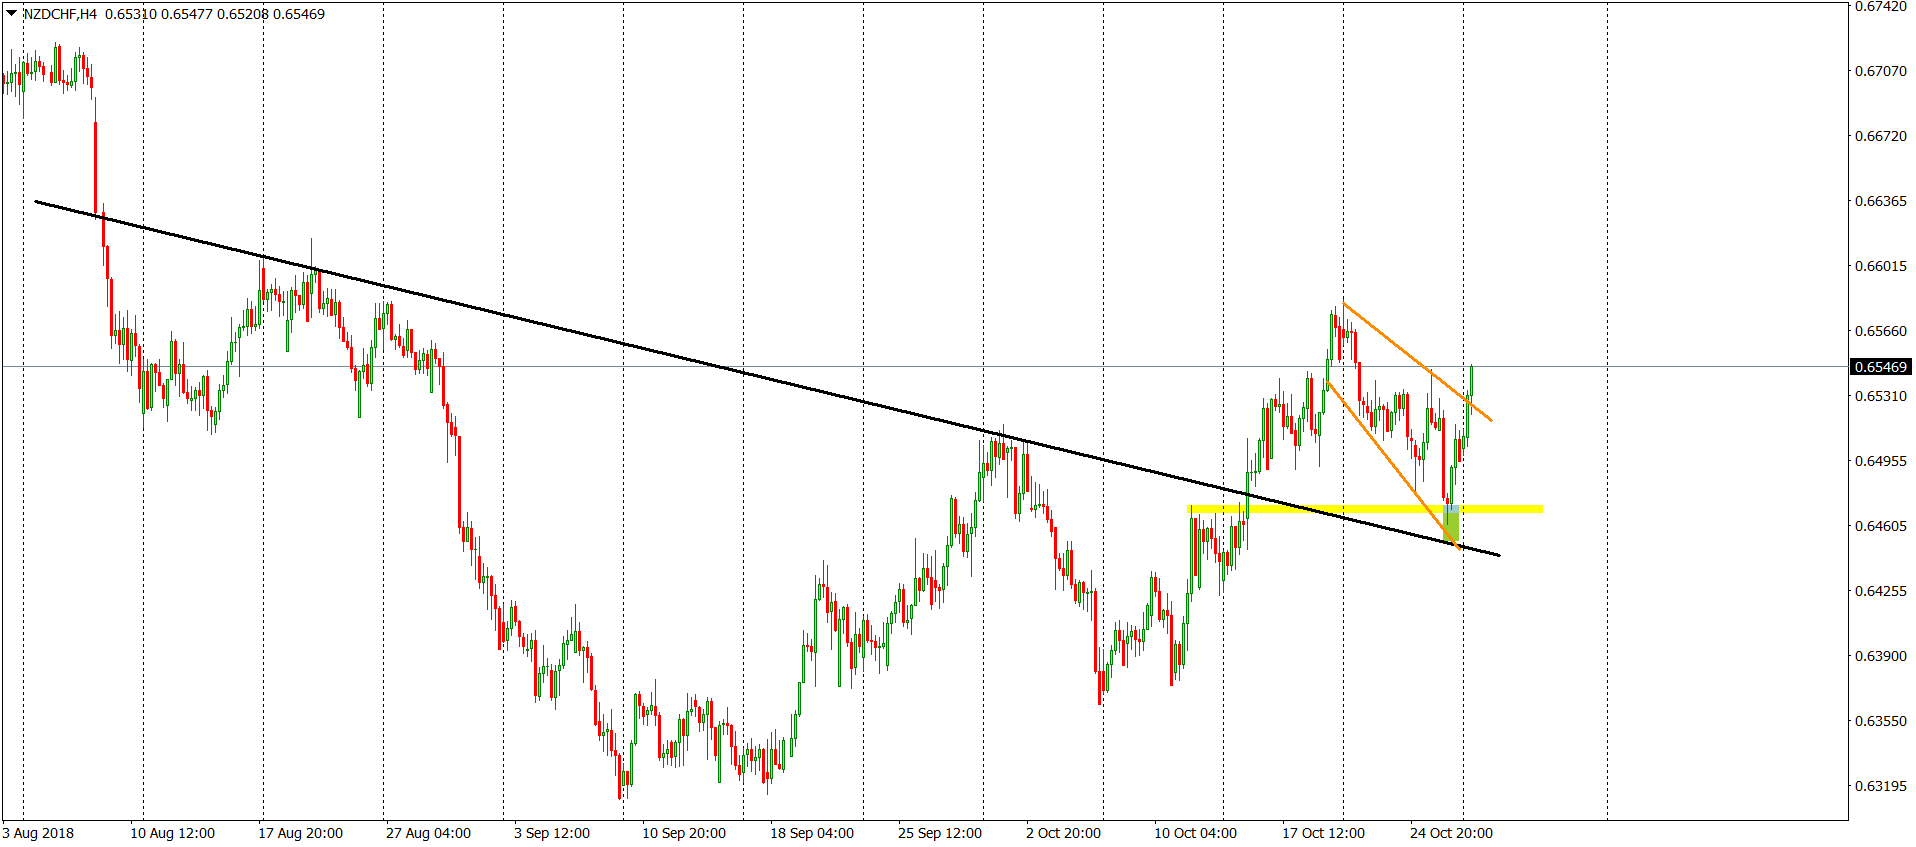
Last week, we did an analysis of the AUDCHF pair. Now it’s time for its little brother: NZDCHF. The setup we have here is great for long-term investors as it is present on both the H4 and D1 charts. Our outlook on this instrument is positive.

Between August and the middle of October, the pair formed an inverse Head & Shoulders pattern. On the 15th of October, we got a breakout of the neckline (black), which gave us a buy signal. The NZDCHF pair listened and went higher. The beginning of last week brought us a bearish correction (red lines), which aimed at the neckline to test it as a closest support. The test was positive for buyers and the pair went higher. The correction formed a wedge and the new week has brought us a breakout of the upper line of this pattern, which is a legitimate signal to go long. That is the beauty of price action!
Positive sentiment here remains as long as we are above the yellow horizontal support. That gives us a lot of space for a bearish correction, but in my opinion, after today’s breakout, the price should mostly aim higher.


Leave A Comment