In this analysis, we will combine two “technicalities” that many people have probably never even thought about, and show how in combination and over the course of a retirement – they can completely change our day to day quality of life.
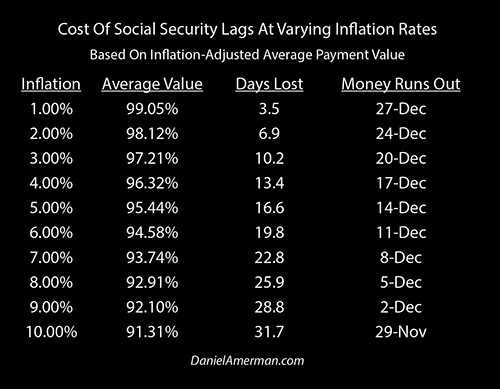
We will examine how these factors can in combination cost the average retiree a full month of income on a purchasing power basis within 10 years. For someone who depends on Social Security for all or a major part of their income, this means that they would have 12 full months of expenses – but the money to pay the expenses would run out by November 29th.
If we take these same two technicalities out for 20 years – then more than seven weeks of income purchasing power will be lost. Which means that the money runs out by November 9th.
When we fully understand the long-term impact of these seeming subtleties, then we get something new and important: an additional screen for retirement decisions that can change the decisions we make today. And in the process, help determine whether we ultimately have enough money to make it through the end of the year – or we run out in November.
Quick Summary Of Analysis Parts 1 & 2
As established in the first two analyses of this series, Social Security is not fully inflation-indexed as a matter of design.

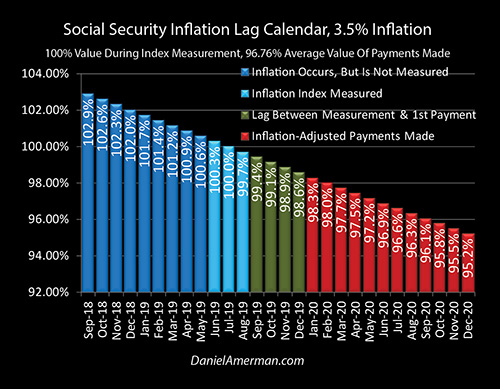
There are instead two distinct forms of inflation lags as explored in the Part 1 analysis which is linked here. We have the lag between when inflation is measured (the light blue bars) and when the first payment based upon that measurement is actually made (the red bars).
And then on top of that, we have a steadily decreasing purchasing power for each benefit over the course of the year which with historically average inflation means that the December benefits are likely to have a purchasing power of only 95 cents on the dollar.

As established in that first analysis, at higher rates of inflation just these two seemingly trivial factors of the initial inflation lag and then the impact of lower benefit values over the year are enough by themselves to reduce the purchasing power of our benefits by a full one month per year.
And at many of the annual inflation rates that we’ve experienced over the last 30 or 40 years, inflation lags by themselves are enough to cost us two or three weeks of standard of living per year in terms of purchasing power, at least when compared to what genuine fully inflation-indexed payments would look like.

In Part 2 of this series of analyses as linked here, we moved from long-term averages to what has been happening in recent years.
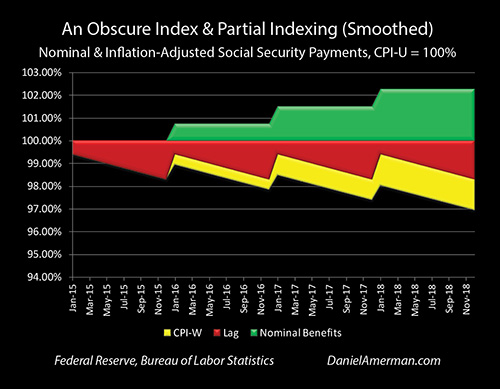
We’ve had a much lower government reported inflation rate and we’ve had much lower benefit increases. Crucially, we’ve also had a mismatch between the benefit increases as determined by the government using its detailed methodology with the CPI-W index, and what the government reports to be average inflation for the nation with the CPI-U index.
Again these may sound very minor but even in a relatively short period of time we can see how the yellow area of purchasing power lost to this index mismatch steadily decreases standard of living for the nation as a whole in terms of retirees who are relying upon Social Security, or other retirees such as federal government employees who are receiving their own inflation indexed plans.
Very Small Changes
The difference between the CPI-U and CPI-W inflation-based indexing methodology used by the government in recent years is a subtlety – but it is not the only subtlety. As we will be exploring herein, the fundamental question that will determine standard of living for many millions of retirees is whether their benefits will grow at exactly the same rate as their expenses in retirement – or whether they won’t.
There are many potential sources for a mismatch like what we’re seeing here – or a much larger mismatch.
It could be the geographic location that you live in – expenses grow at different rates in different parts of the country.
This also ties very directly into the critical rent versus own in retirement decision when it comes to housing. Renters generally have a higher exposure to rising shelter costs than do homeowners.
One of the factors to be taken into account is that taxes – particularly on a state and local basis – tend to grow over time. These are not included in the inflation indexes. So just state and local taxes by themselves are enough to impact long-term financial outcomes in retirement (an issue which affects both homeowners and renters).
There’s also the critical and underappreciated factor that the obscure CPI-W inflation index which Social Security benefit indexing is based upon is not only not based on retiree expenses – but quite ironically, it is designed to exclude retiree expenses.
The widely reported Consumer Price Index for All Urban Consumers (CPI-U) includes retirees, but they are a minority compared to those still working. The little reported Consumer Price Index for Urban Wage Earners and Clerical Workers (CPI-W) measures price levels only for the average expenses of urban workers. Which by definition means they are not retired. Which leaves us a sharper difference between the different expenses of younger current workers, and those of older retirees, than we would have with the CPI-U.
Retirees typically have a different composition for their spending than do younger people. For those older people on fixed incomes, shelter, food and medical care may consume a larger part of their spending. There have been higher inflation rates in each of those categories in recent years than we have seen with either the overall CPI-U or CPI-W, and many retirees are already finding that their benefits are not keeping up with their personal rate of expense inflation.
Again – this difference between retirees and current workers is exacerbated by Social Security benefit indexing being based on the worker-only CPI-W, rather than the broader CPI-U. Which would tend to imply that we’re going to have significantly higher expense growth over time for most retirees than what the benefit increases will be keeping up with.


Leave A Comment