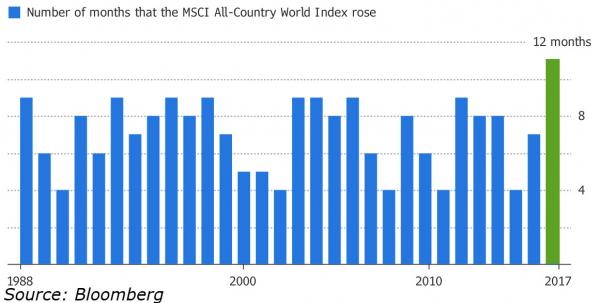
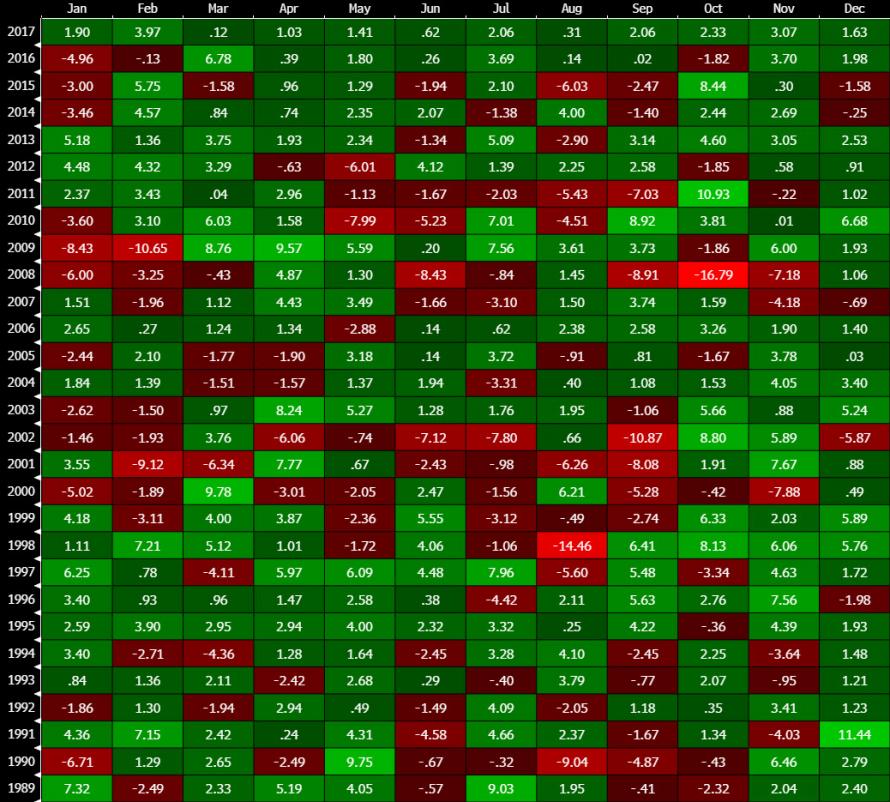
Unless the world comes to a very serious end in the next few hours, global equity markets are about to do something they have never done before… rise for 13 consecutive months.
Not one losing month in 2017…

But it’s not just global equities, the S&P 500 is now up 14 straight months and in just a few hours will complete it first “perfect year” of positive total monthly returns ever…

On a side-note, the S&P 500 is up 21 of the last 22 months.
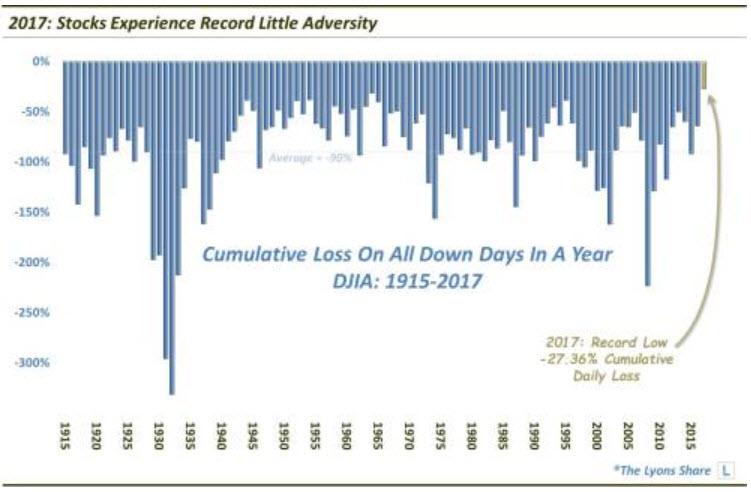
But not only was the upside incredible, there was no downside!! As Dana Lyons details, based on cumulative losses, stocks endured less adversity in 2017 than any other year on record, going back more than 100 years.
Specifically, we tabulated the amount of losses incurred during every down day in the market. We used the Dow Jones Industrial Average (DJIA) as it has a longer history than the S&P 500. And based on these calculations, the stock market enjoyed less adversity in 2017 than any other year in history going back over 100 years (our daily DJIA data begins in 1915).

As of December 27, the DJIA had lost a cumulative -27.36% on all of its down days throughout 2017. That shattered the prior record of -31.45% set in 1965 which, by the way, is the only other year that saw less than -38% in total losses. So, other than 1965, 2017 experienced nearly 30% less adversity than any other year on record.
To add further context to this extraordinary performance, the average cumulative loss on down days during a year in the DJIA is 90%. That comes out to an average cumulative monthly loss of 7.5% — versus 2017’s average monthly loss of a mere -2.28%.
And finally, as we detailed previously, 2017 was a record low year for average volatility…

Furthermore, as the chart states, the maximum level reached by the VIX in 2017 was 17.28. That is the lowest maximum level attained in any year since inception — and 60% lower than the “average yearly max”. Obviously, 2017 was an extraordinary year in its lack of stock volatility.


Leave A Comment