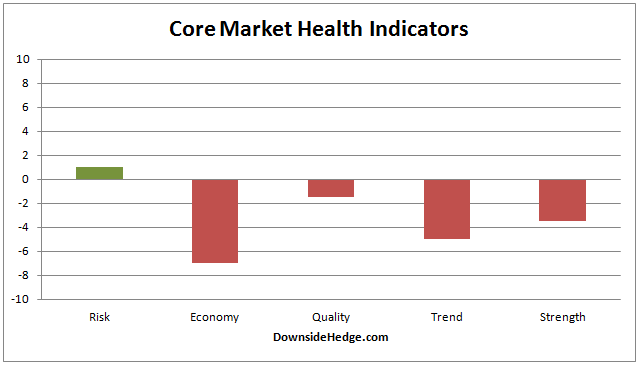
Over the past week most of our core market health indicators improved a bit. Our core measures of risk made it into positive territory. As a result, long/cash allocations will now be 20% long and 80% cash. The hedged portfolio will be 60% long stocks we believe will out perform in an uptrend and 40% short the S&P 500 Index (SH). The volatility hedge is 100% long (since 10/24/14).
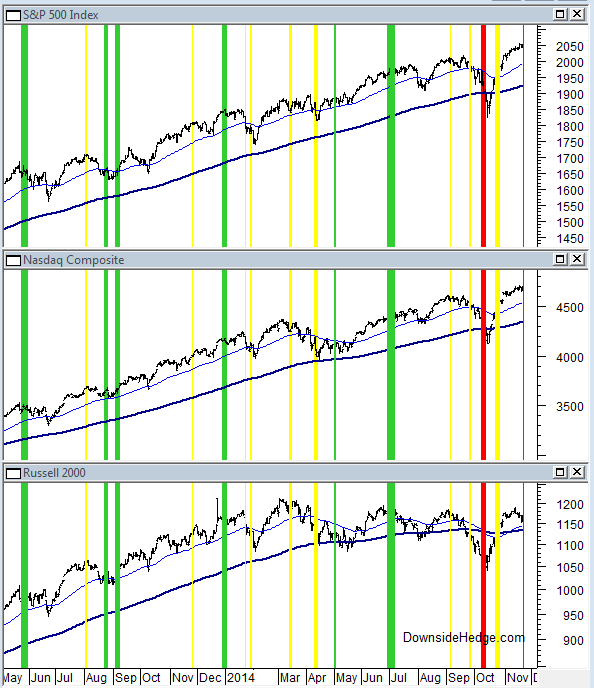
Below is a chart that shows changes to our portfolio allocations. Green lines represent adding exposure and reducing the hedge. Yellow lines represent reducing exposure and adding a hedge. Red lines represent an aggressive hedge using a security that benefits from increasing volatility.

This week marks the first week since July that all four components of our market risk indicator are positive. Our market risk indicator is completely independent of our core measures of risk mentioned above so we now have two sets of indicators confirming that market participants are comfortable. It feels more like complacency (and top ticking) to me, but my opinion doesn’t matter to my portfolio allocations. I let market internals guide me instead.
Below is a chart with the current readings for our health indicator categories.


Leave A Comment